
Embark on a YouTube adventure like never before with 6 ways to use advanced YouTube analytics. This guide is your treasure map to unlock the secrets of YouTube success. Discover how to understand your audience, boost video performance, and conquer the YouTube algorithm.
Say farewell to guesswork and embrace data-driven finesse as you set sail towards content creation glory. Are you ready to harness the full potential of YouTube Analytics? Let’s embark on this thrilling voyage together!
What Are YouTube Analytics Groups and Why Should Marketers Care?
YouTube Studio offers a feature called groups, which allows you to create collections of videos from your channel’s Analytics tab for analytical purposes. These groups do not have any public visibility, unlike YouTube playlists. You can include various types of content in a group, such as videos, playlists, or entire channels, with a maximum limit of 500 items.
YouTube groups serve multiple functions, including comparing content categories, measuring organic campaign performance, and analyzing organic video funnels. Think of them as publishing tags that help you organize content into topical or campaign-based collections, enabling you to generate more detailed reports.
Collaborators with eligible roles across your channel can access and assess group analytics, facilitating teamwork and collective evaluation of content collections. By utilizing these insights, you can enhance your YouTube channel strategy and work towards achieving more ambitious marketing goals.
Without using groups, YouTube’s options for analyzing multiple pieces of video content are rather limited, typically offering only channel overviews or evaluations of individual videos or posts. However, playlists do exist, and they provide analytics for understanding the performance of all videos within them. The caveat is that playlists are publicly visible, making them unsuitable for analytical purposes.
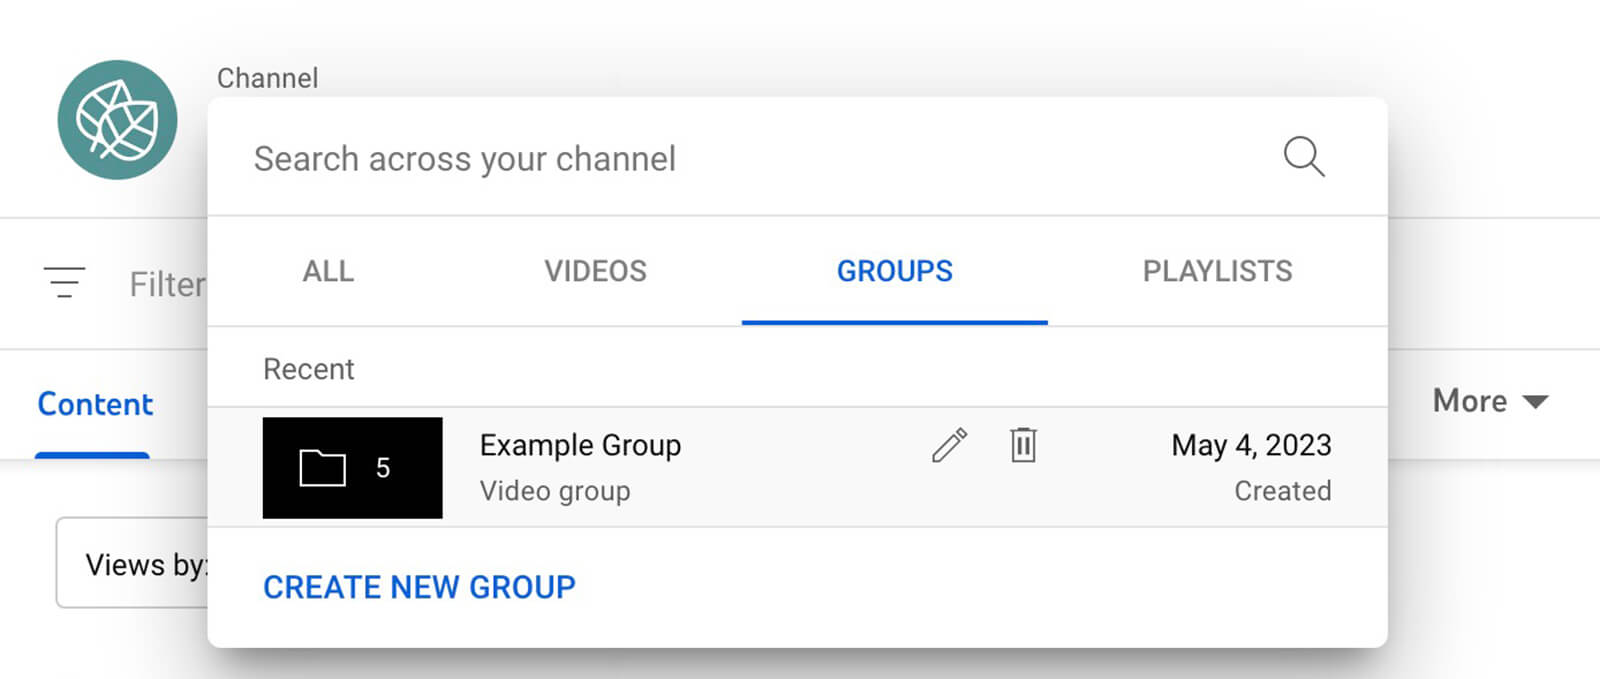
How to Set Up Analytics Groups in YouTube Studio
To create an analytics group in YouTube Studio using a desktop browser, follow these steps:
- Open YouTube Studio and go to the Analytics section. Click on the Advanced Mode link located in the top-right corner.
- Next, click on your channel name in the upper-left corner. This will take you to the search bar, which conveniently displays lists of all your channel’s videos, playlists, and groups.
- To set up your first collection, click on the blue “Create Group” button.
By default, your channel’s recent public videos will appear in chronological order, starting with the newest. You can manually select the videos you want to add by checking the box next to each one as you scroll through the list. If the list is extensive, or if you’re looking for older content, you can use the search bar to find videos by their titles.
If you have a large number of items to add and it becomes cumbersome to scroll and search, consider using video IDs to find specific content efficiently. This method works well, especially when adding multiple playlists to a collection. However, please note that you cannot search by playlist, so you’ll need to know the individual video IDs you want to include.
It’s worth mentioning that you can add any of your channel’s content to a group, regardless of its status (public, private, unlisted, or draft). Once you have set up the group and made your selections, click “Save” to add it to your account. You can access and manage your groups through the “Groups” tab in Advanced Mode search.
6 Questions You Can Answer Using YouTube Analytics Groups
In Advanced Mode, exploring video groups allows you to generate custom reports that provide more in-depth insights compared to YouTube Studio’s standard analytics. These reports are presented in various visual chart formats within YouTube Studio. However, it’s important to remember that exporting these reports is limited to the spreadsheet format. Let’s now delve into the valuable information you can glean from these comprehensive reports.
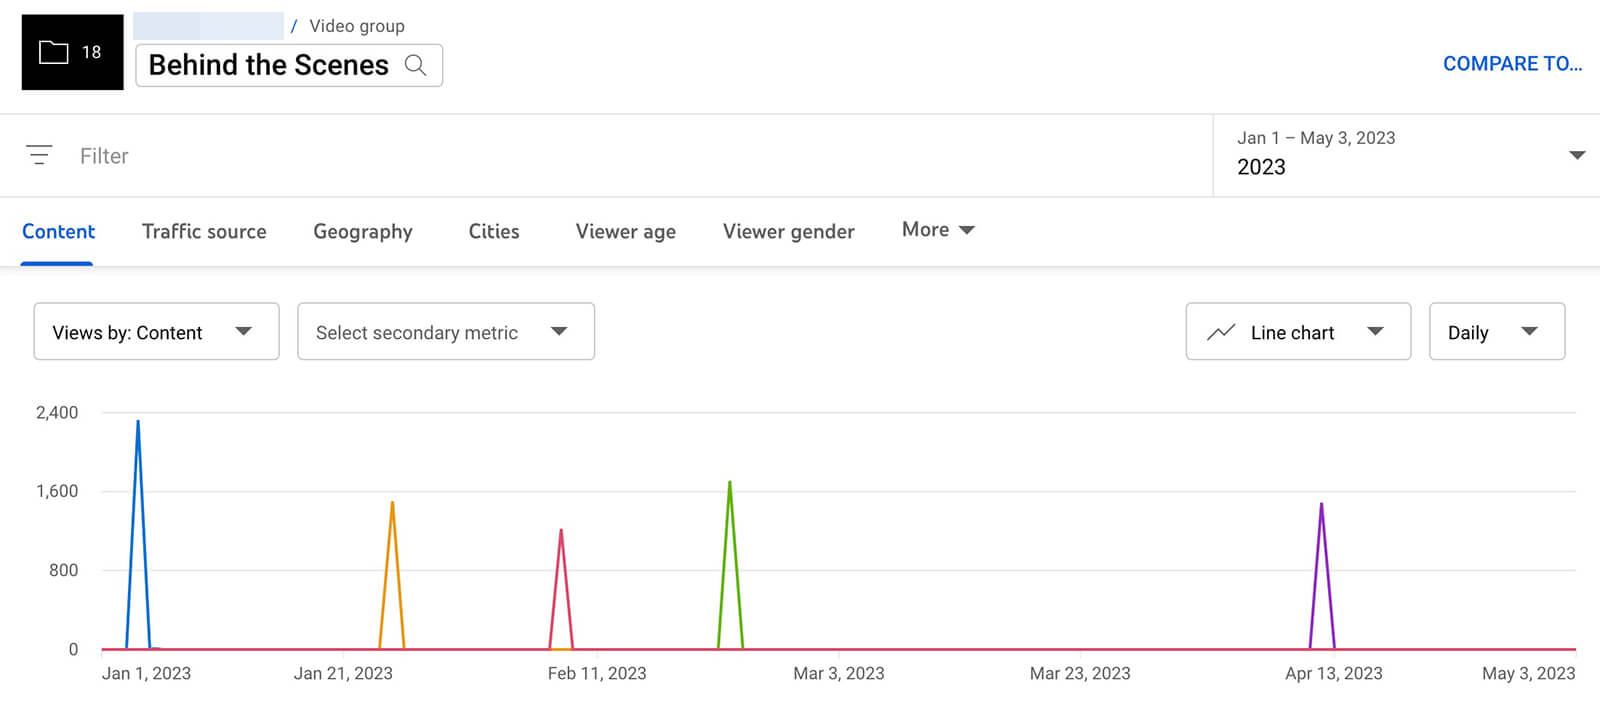
#1: Monitoring Viewer Engagement Over Time
Videos may experience higher views shortly after publishing, but consistent views are expected for regularly-published content on specific topics. Analyzing grouped content using the Views, Watch Time, and Average View Duration reports helps identify patterns and audience interest changes. Insights gained from these reports can inform content strategies and focus on valuable videos for business growth.
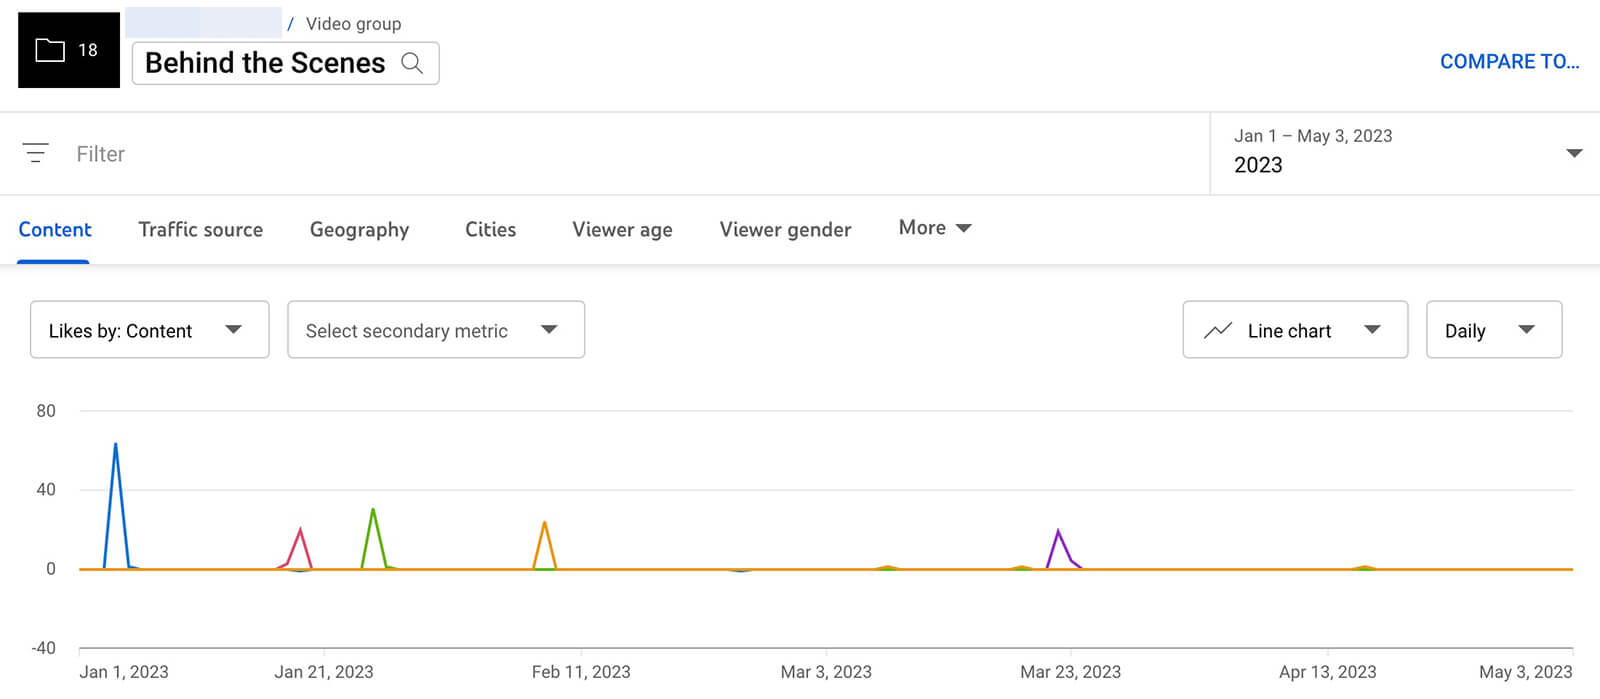
#2: Understanding Viewer Engagement
To gauge viewer response to your content, examine metrics like Likes and Comments over time. However, these alone may not provide the complete picture. If Likes decline, check if it correlates with decreasing views and watch time, indicating a drop in interest for the analyzed topic or style. Consider adapting your approach to revive engagement.
Similarly, decreasing comments may signal declining interest, but analyze comment sentiments to gain deeper insights. To monitor audience sentiment, use the Likes vs. Dislikes report. Occasional low-performing videos may not be concerning, but a consistent trend of more dislikes than likes calls for strategic adjustments to your YouTube channel.
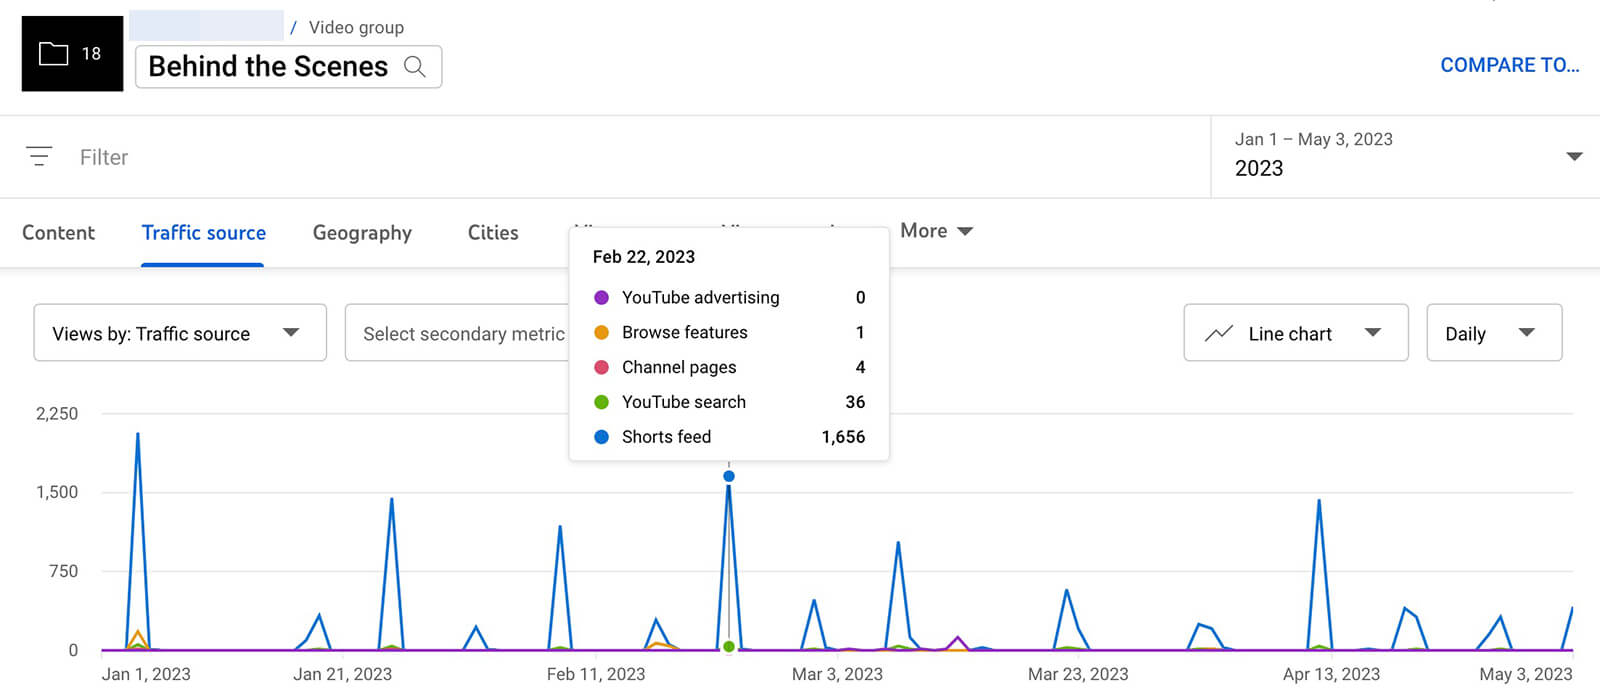
#3: Analyzing Viewer Traffic Sources
YouTube Studio’s traffic report provides insights into how viewers discover your content, usually at the channel or video level. However, when you group videos together, you can track traffic sources over time and observe whether specific sites or search engines continue to drive clicks.
For instance, if your grouped videos typically receive a substantial amount of traffic from YouTube search, a decline in traffic from the platform’s search engine may indicate a need to optimize your content for YouTube search or reconsider the topic and keywords to enhance your YouTube SEO strategy.
Conversely, you might notice a surge in traffic from other sources like browse features or channel pages. On the main Analytics tab, you can examine traffic source data for individual videos in the group to identify the origin of the increased views, such as from a featured playlist or a suggested video.
#4: Tracking Thumbnail and Shorts Feed Impressions
As your channel grows, you want more impressions on viewers’ home pages and Shorts feed. Use group-level reports to monitor these metrics. Thumbnail impressions on home pages indicate positive engagement from subscribers or YouTube recommendations.
Shorts feed impressions show YouTube’s content recommendations. To gain deeper insights, check the Viewed vs. Swiped Away report to see how often viewers choose to watch your videos after seeing them in the feed. A declining trend could impact your channel’s growth.
#5: Tracking Views from Clips and Remixes
For video groups with long-form content, YouTube’s Native Clips tool can help make the content more digestible for your audience. Keep an eye on the views and watch time generated from clips within any group. If clips prove to be a successful source of views, consider incorporating them more into your strategy.
Monitoring remixes also offers valuable insights into your audience’s response to the group of videos. An increasing number of remixes indicates positive viewer engagement with your content. To assess creator sentiment, check remixes for specific videos on the main Analytics screen.
#6: Comparative YouTube Channel Analytics
Analyzing reports for specific video groups provides actionable insights for content improvement. However, with YouTube’s comparative analysis, you can delve deeper into your video content’s performance.
To compare performance over different quarters, select a group and click “Compare To” in the upper-right corner, then choose “Period-Over-Period.” Use various reports, such as watch time, impressions, and engagement, for this competitive analysis.
Additionally, you can compare two different video groups against each other. After selecting a video group, click “Compare To” and choose a second group. Use the reports to understand how the two groups perform in terms of average time watched, shown in feed, or other relevant metrics.
Comparative charts help identify which video formats yield the most effective results in achieving marketing goals. By comparing groups with distinct differences, such as before and after changes in thumbnails or hooks, you can accurately measure the impact of updates.
Incorporating YouTube group analytics into your video marketing insights workflow can be highly beneficial. By creating groups based on campaigns, funnels, content niches, and video experiments, you gain the ability to analyze performance and identify trends with greater ease. These findings allow you to make informed adjustments to your YouTube channel strategy and achieve significant milestones.