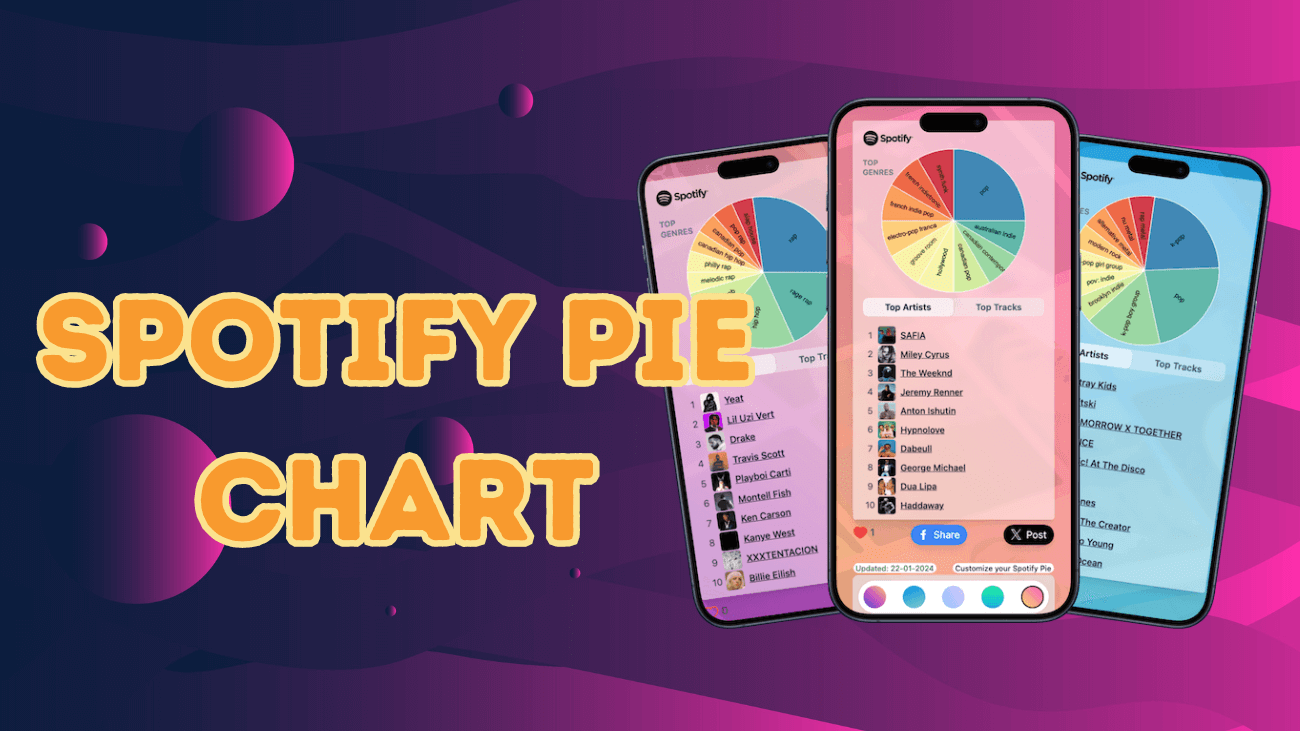
Every year, we look forward to Spotify Wrapped, the feature that highlights our favorite songs, artists, and genres from the past year. But let’s be honest—waiting a whole 12 months can feel like forever, and I know I’m not alone in that. That’s where the Spotify Pie Chart comes in.
This fun new trend lets you link your Spotify account to a tool that creates a colorful chart of your monthly listening habits. People are sharing their pie charts all over X, Reddit, and TikTok, and it’s a great way to see what you’ve been jamming to recently!
How to Create a Spotify Pie Chart?
Spotify Pie lets you explore your listening habits by showcasing your top genres and artists in a visually appealing pie chart. It’s easy to understand and perfect for sharing with friends. This trend was started by UCLA student Darren Huang, who created this fun tool.
Getting started is simple! If you want to join in on the trend and share your musical journey, here’s how:
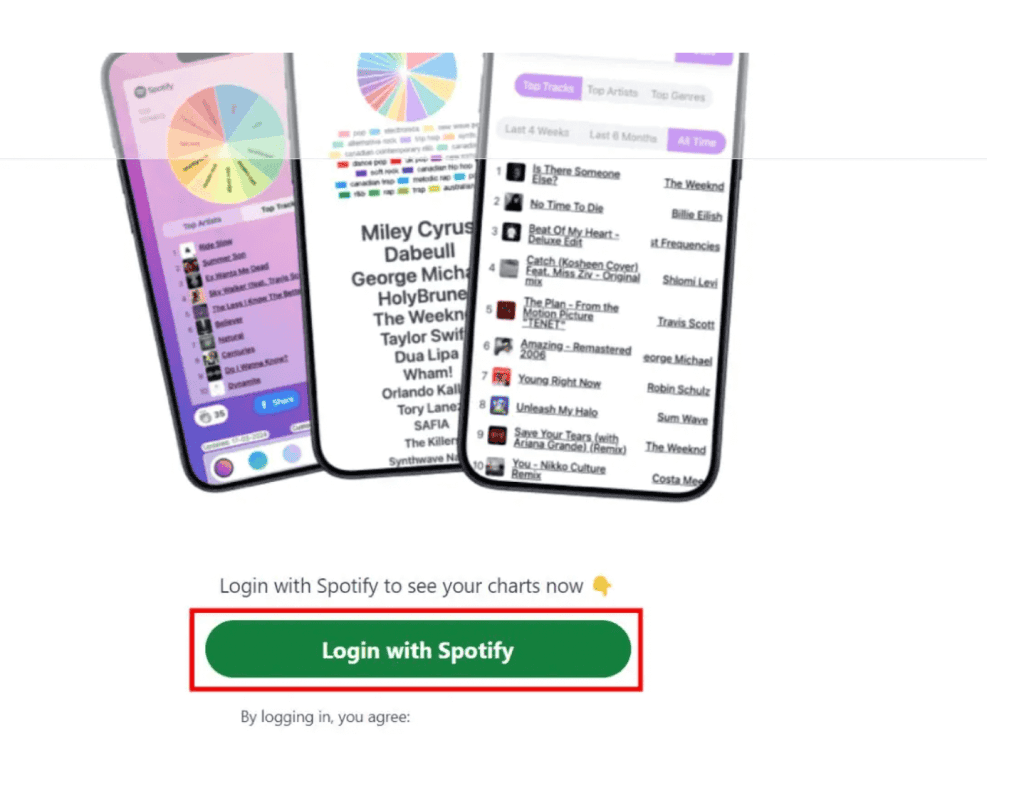
- Visit the Spotify Pie website and click on the Login to Spotify button.

- Enter your Spotify account credentials to sign in.
- Click Agree to connect your account with Spotify Pie.
- Wait a moment as the tool analyzes your music and generates your pie chart.
- Once it’s ready, click See Your Spotify Pie to discover what genres you’ve been enjoying.
If you prefer the classic version, you can switch to the older Spotify Pie Chart by clicking on Classic Spotify Pie is here. Just keep in mind that there’s no download or direct sharing option available for this version. So you’ll need to take a screenshot of your pie chart to share it on X, Reddit, TikTok, or wherever you like!
How does the Spotify Pie Chart Appear?
For avid Spotify listeners, they rely on music to make the daily one-and-a-half-hour metro commute more enjoyable. Naturally, they were curious to see what their pie chart would reveal about their listening habits. The results were not surprising.
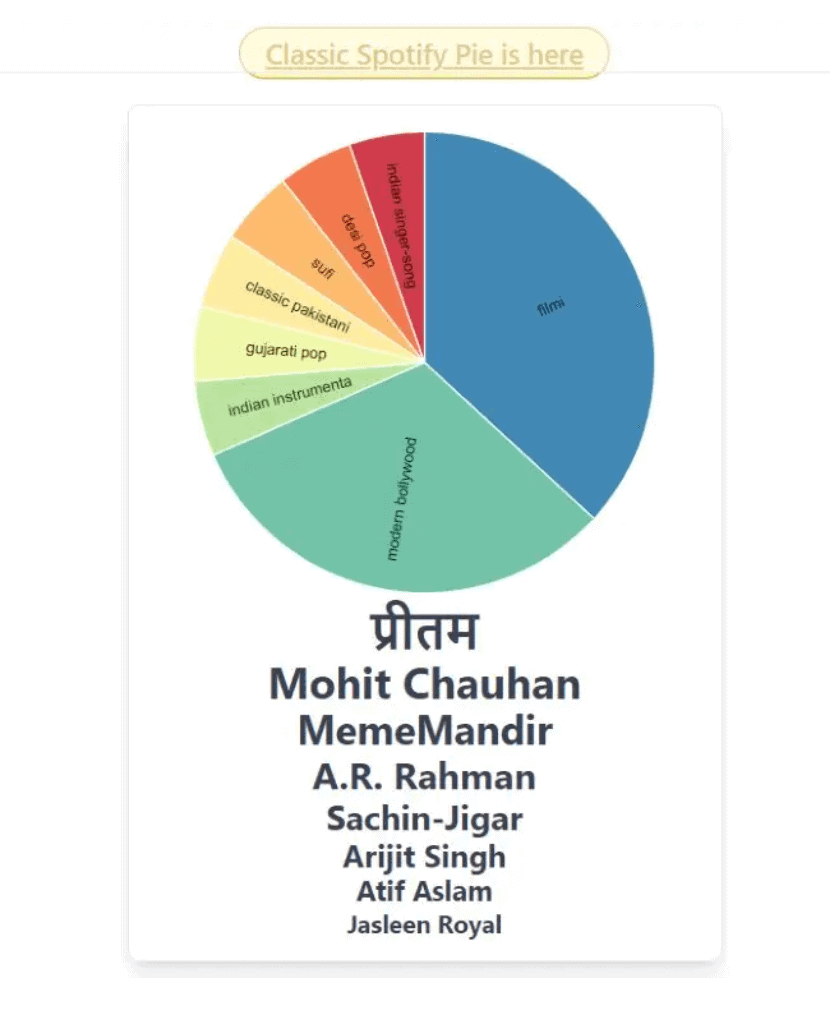
After enduring a 15-second ad, you receive your chart. As expected, Bollywood music dominated the findings. Romantic and heartbreaking songs are the user’s favorites. They admitted to jamming recently to MemeMandir’s catchy track “O Skibidi Re.” That’s why it made it into the top three.
While appreciate the concept of quickly viewing their top genres and artists, some users are not impressed with the new Spotify Pie Chart. The colors appear dull, and it only displays the top eight artists. In contrast, the classic version is much more vibrant. It showcases up to 20 of the most-listened-to artists.
Final thoughts
Spotify Wrapped started the trend of sharing yearly music stats with friends. But, as mentioned in the introduction, waiting a whole year can feel really long for those used to quick TikTok videos. That’s why new ways to explore and share music data often go viral, sometimes making a comeback long after they first become popular.
Spotify Pie isn’t the only way to check Spotify data, though. There’s also Recieptify, which shows users’ top songs, artists, and genres like a fun supermarket receipt. Another option is Spotify Bedroom, which creates a digital bedroom based on what users listen to. These are just a few examples, and many other Spotify stats tools are out there.
It’s a playful trend, and it’s easy to see why people like it. For anyone who listens to music on Spotify, trying out their Spotify Pie is definitely worth it!