Let continue with some Youtube analytics metrics to track and improve video performance.
6. Analyze Audience Retention
Monitoring your views over time is necessary, however evaluating the quality of your views is paramount to success.
By opening up your Audience Retention page, you can uncover the exact times in your video when people stopped watching. Utilizing this info, you may figure out where you lost your viewers’ attention and what could have caused them to leave, which helps you prevent similar errors in the future.
Check out the Audience Retention graph below.

We will see that the average view duration is 1:13 which is about 84% of the entire video. This may seem nice, nevertheless, it’s additionally a short video by YouTube’s standards. You’ll inevitably see a more important drop-off in longer videos.
You get two main views in this report, which you could switch between utilizing the tabs above the graph:
- Absolute audience retention: This graph shows you what particular parts in your video are the most popular by looking at the number of views for that moment as a percentage of the total number of video views. Via this, you may determine certain viewer behaviors, like skimming past the introduction.
- Relative audience retention: This report allows you to compare your video against other YouTube videos of the same length to see whether yours is below or above average in terms of how it keeps a viewer’s attention throughout.
When you can pinpoint a specific time in your video where you suddenly lose a big percentage of viewership. You may then determine what your video is conveying at that time to trigger such a negative response, or incorporate a call to action before that time to capture viewers before you lose them.
The viewer’s retention page only permits you to see the analytics for one video at a time, not for your channel as a whole. It’s a good idea to assess a number of your videos to find patterns of issues that may be addressed or if you should shake up your video format entirely.
7. Track Your Subscriber Rate
YouTube Subscribers in an e-commerce context may be potential or existing clients with an interest in your merchandise or niche of content material.
So it’s also necessary to monitor the fluctuations of your subscriber base. It will permit you to understand the overall reach of your YouTube content material as a whole, as opposed to a single video and the way each video contributes to gaining or dropping subscribers.
Under the Subscribers report, you may view the number of subscribers you lost or gained on a video-by-video basis.

This one’s pretty obvious: The more subscribers you have, the more people there are to potentially see your channel’s video content material via the Subscriptions stream on the YouTube homepage. Thus, the more exposure your merchandise and brand will get.
Utilizing calls to action in the type of YouTube cards or a pitch that you record as a part of your video can go a long way towards gaining subscribers.
Aside from your Subscriber fee, you may also calculate your Subscriber ratio for a video by dividing the number of views by the net subscriber gain. When you have a video that performs particularly effective in terms of generating subscribers, consider investing more time (or money) in promoting it.
8. Study Social Shares
Social media can play a giant role in selling your videos. So it’s smart to take note of who’s sharing your content material and the way.
Once you click on the Sharing page in YouTube Analytics, you may view the number of shares you have received over time and on quite a lot of platforms, from social networks to messaging apps.
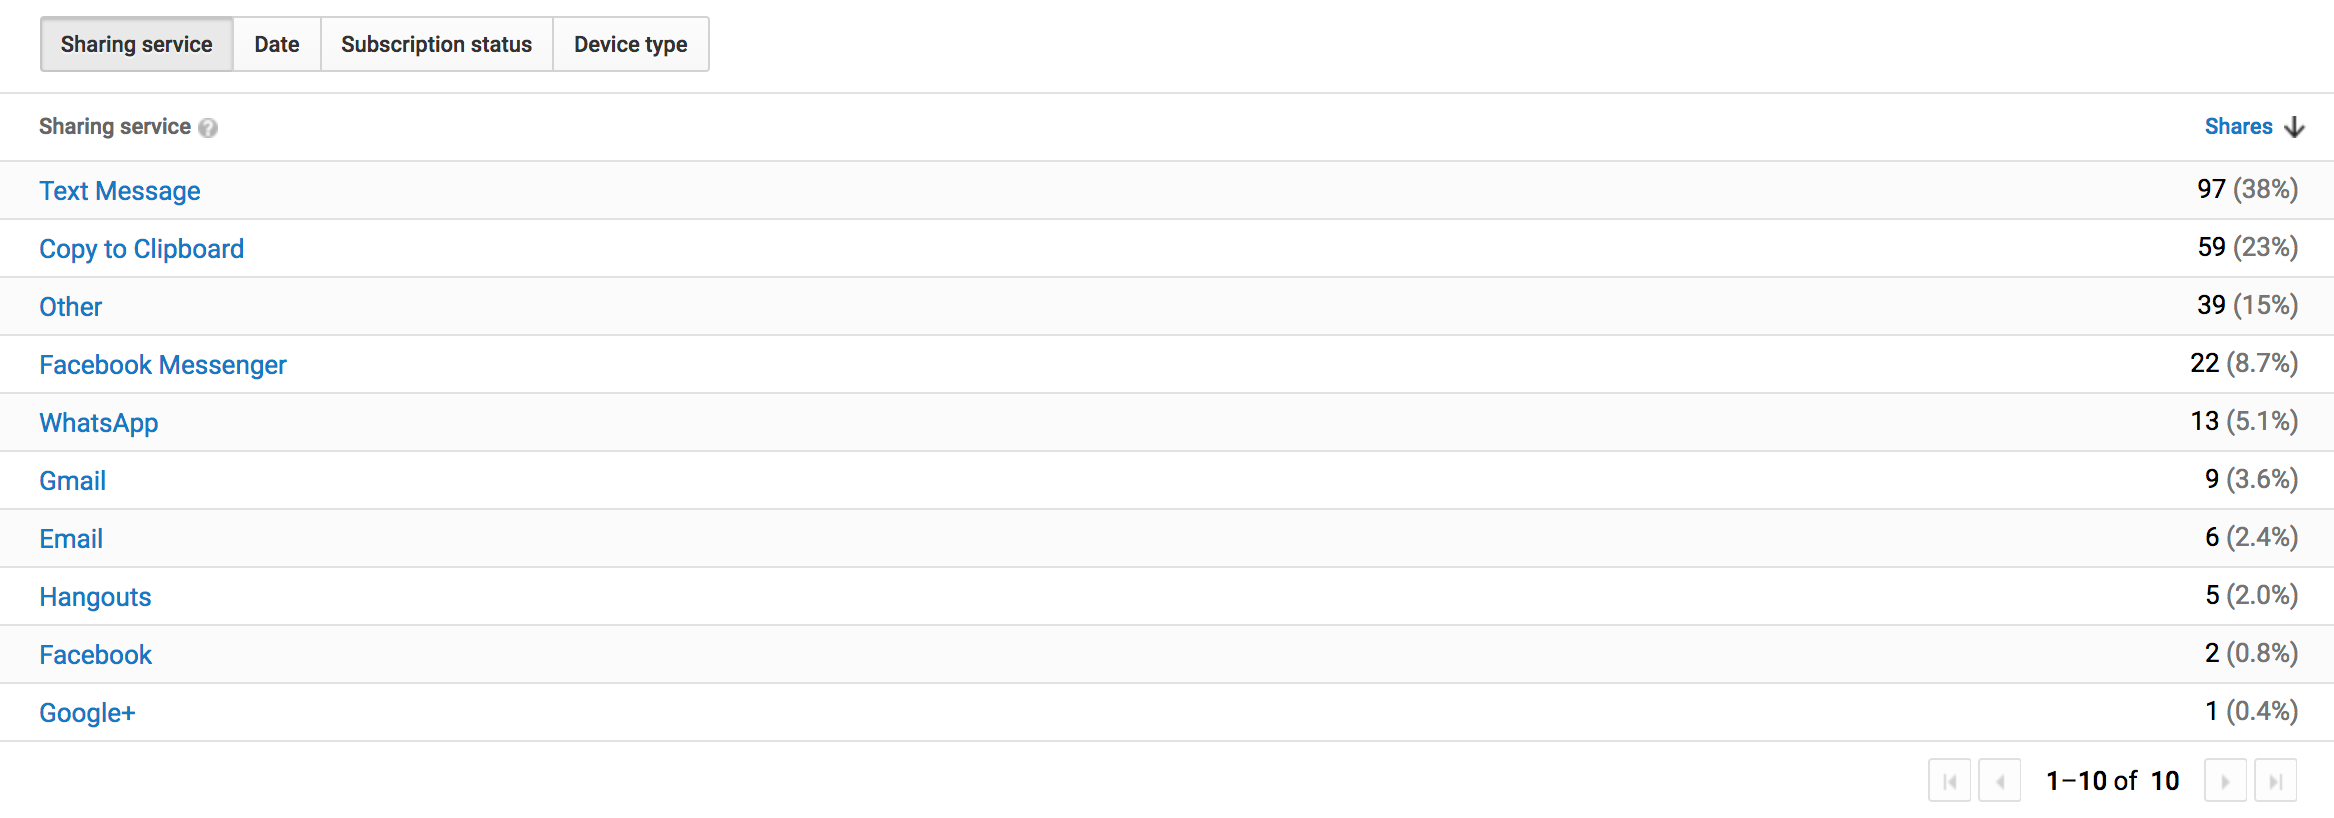
In the report above, you may see this instance video is being shared mostly via private messaging apps, something that you may not expect or otherwise be able to track.
Take steps to incorporate your video content material into your social media strategy to boost the effectiveness of sharing, particularly where your viewers are already sharing your videos.
9. Monitor Comments
Comments are a key component of viewers engagement. Maintaining tabs on who’s commenting and what they’re saying might help you convert viewers into clients or at the very least improve engagement for that video or other content material.
By clicking on the Comments tab of the YouTube Analytics section, you may see the frequency and dates of your comments, as well as a section dedicated to displaying your total amount of comments on each video.
While these numbers are interesting, the Community part is also helpful for acting on opportunities to engage with your viewers and getting qualitative feedback.

Search for chances to:
- Delight your viewers with insight or an amusing remark.
- Highlight any products or services you promote.
- Direct viewers to other related content material or resources you’ve created.
It’s necessary to portray your brand as an approachable and engaging one. Try to respond to comments in your video in a useful fashion. This will also help improve your total comments, a great indicator to viewers of an attractive video.
You may even pin one of your comments to the top to direct your viewers to relevant parts of your site.
10. Check Your Likes and Dislikes
Likes and dislikes exemplify viewer comment on your videos.
By clicking on the Likes and Dislikes page, you may analyze viewer reactions over time. While it is important to take note of your dislikes, as you obviously need to reduce them, dislikes are inevitable and need to be viewed relative to the number of likes you’ve gotten.

In case your videos are getting lots of Dislikes, ask yourself the following questions:
- Did your video fail to deliver on what was promised in the title?
- Are you reaching the wrong viewers?
- Do you need to enhance your production quality or delivery?
- Are people simply disagreeing with what you’re saying?
You may usually discover the reason for a disproportionate number of dislikes in the comments so you’ll know what changes you may make in the future.
Additional YouTube Analytics Tools
Of course, your built-in YouTube Analytics dashboard isn’t the only source of data you have at your disposal.
There are other third-party sites and tools that may allow you to understand YouTube:
- Social Blade: In case you’ve ever wondered about your competitors, potential partners, or role models on YouTube, you could use Social Blade to realize some insight into how other channels are performing and compare them to your own.
- VidIQ: This Chrome extension shows a scorecard next to the video you’re watching on YouTube, providing in-depth insights at a glance to help you understand what works in YouTube as you go about utilizing the platform.
- Google Trends (YouTube filter): Google Trends allows you to analyze search volume trends to search out chances to create content material around trending topics. Now with its new YouTube filter, you may analyze search trends specifically on YouTube.
As a creator or a marketer, data is a present that you shouldn’t miss. Otherwise, you’re shooting in the dark every time, unaware of whether you’re getting closer to or further away from your goal.