Are you unsure about the effectiveness of your YouTube videos, remixes, or shorts? Are you struggling to find the YouTube metrics you need? All are important data served to achieve the highest efficiency in managing your Youtube channel, so is there a tool that can serve that? You’ll discover how to analyze any kind of YouTube content in this article using YouTube Studio Analytics.
What’s New in YouTube Studio Analytics for 2022?
YouTube announced several new analytics tools and a total overhaul of the platform’s channel-level analytics in May 2022. In the first half of 2022, these new Youtube metrics features started to be released. All channels should have access to these in YouTube Studio as of September 2022.
#1: Channel-Level Content Analytics
The channel level is where YouTube Studio metrics have undergone the most significant change. The YouTube Studio’s channel-level stats no longer include the Reach and Engagement tabs. You may find all reach and engagement metrics related to the material you’ve published on the Content tab. Let’s have a look at the available metrics.
All-Content Metrics
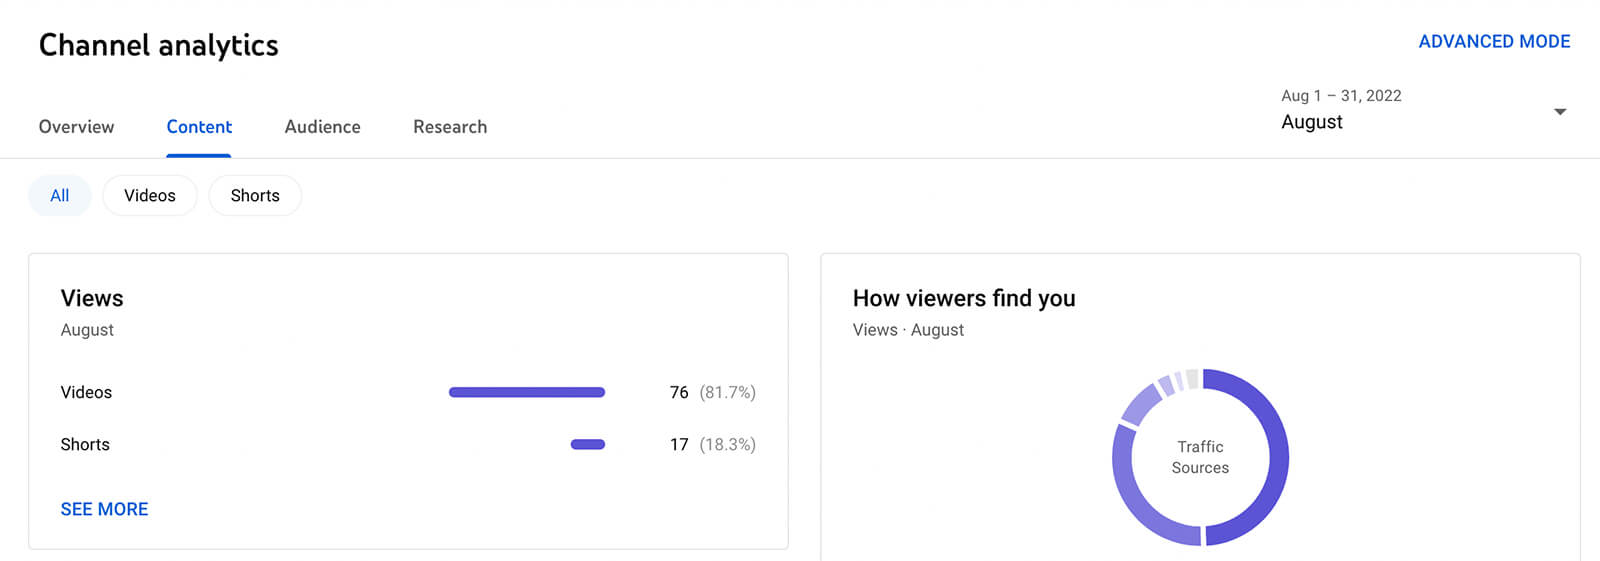
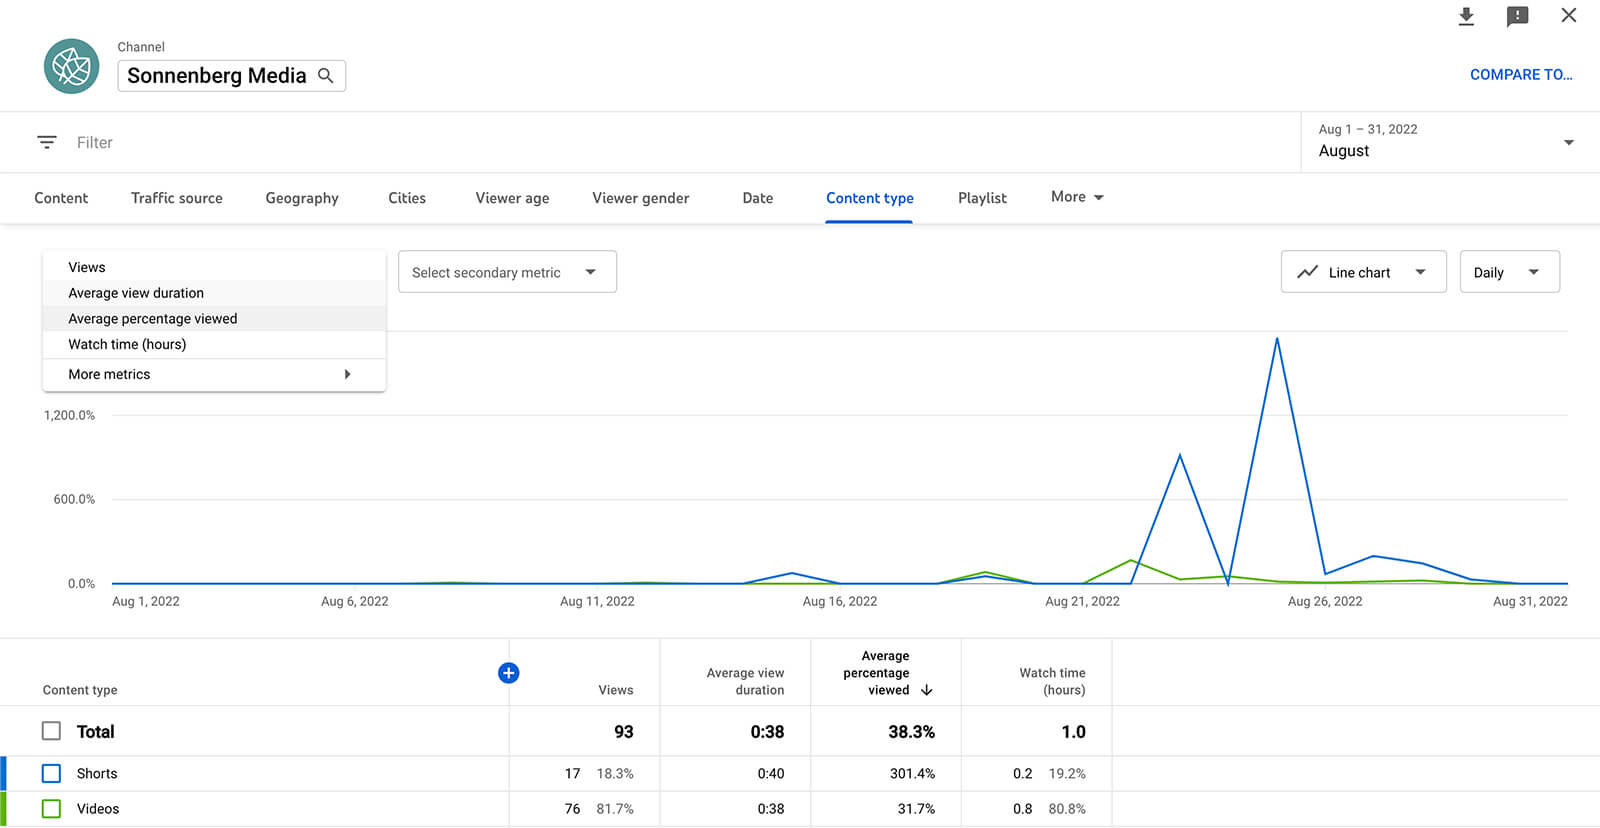
To get a list of all the content on your channel, select the All chip on the Content tab. Look at the Views panel to see what kind of content is gaining the best traction.
In order to access advanced view analytics, click the See More option.
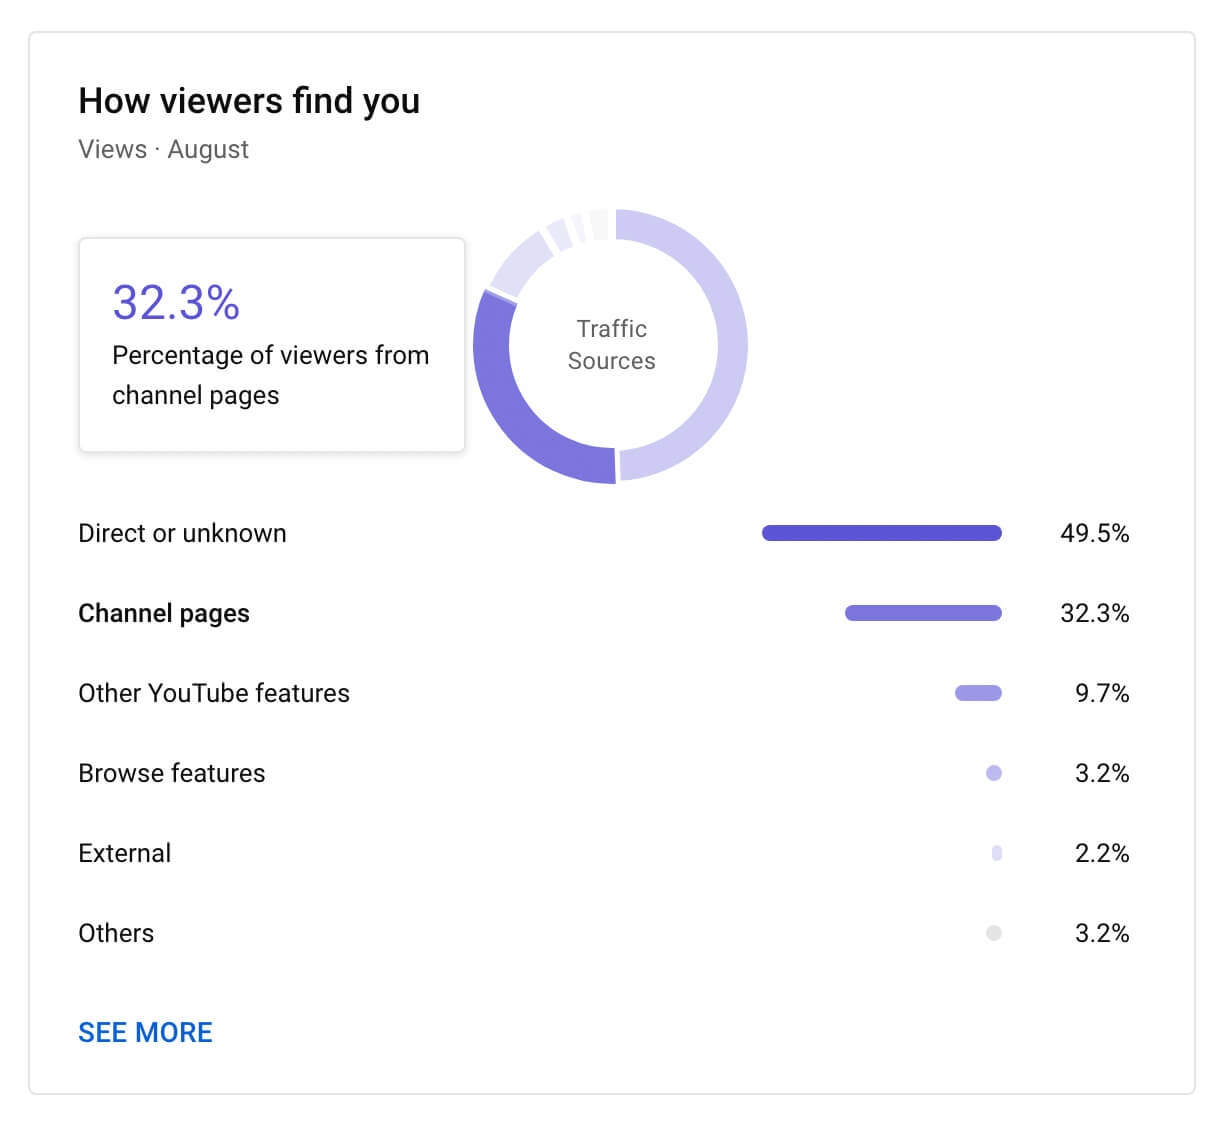
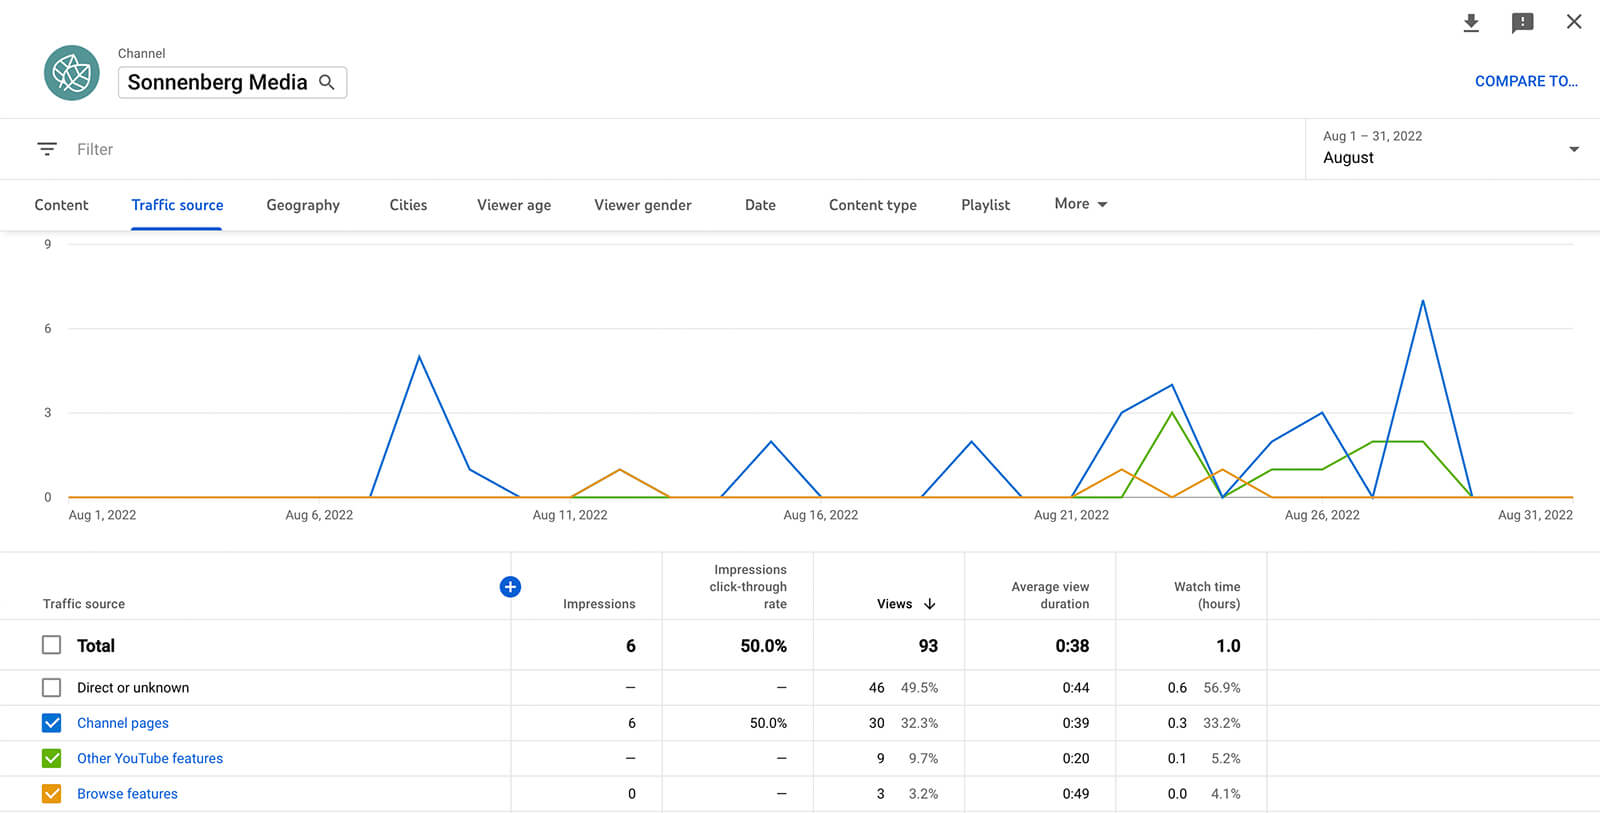
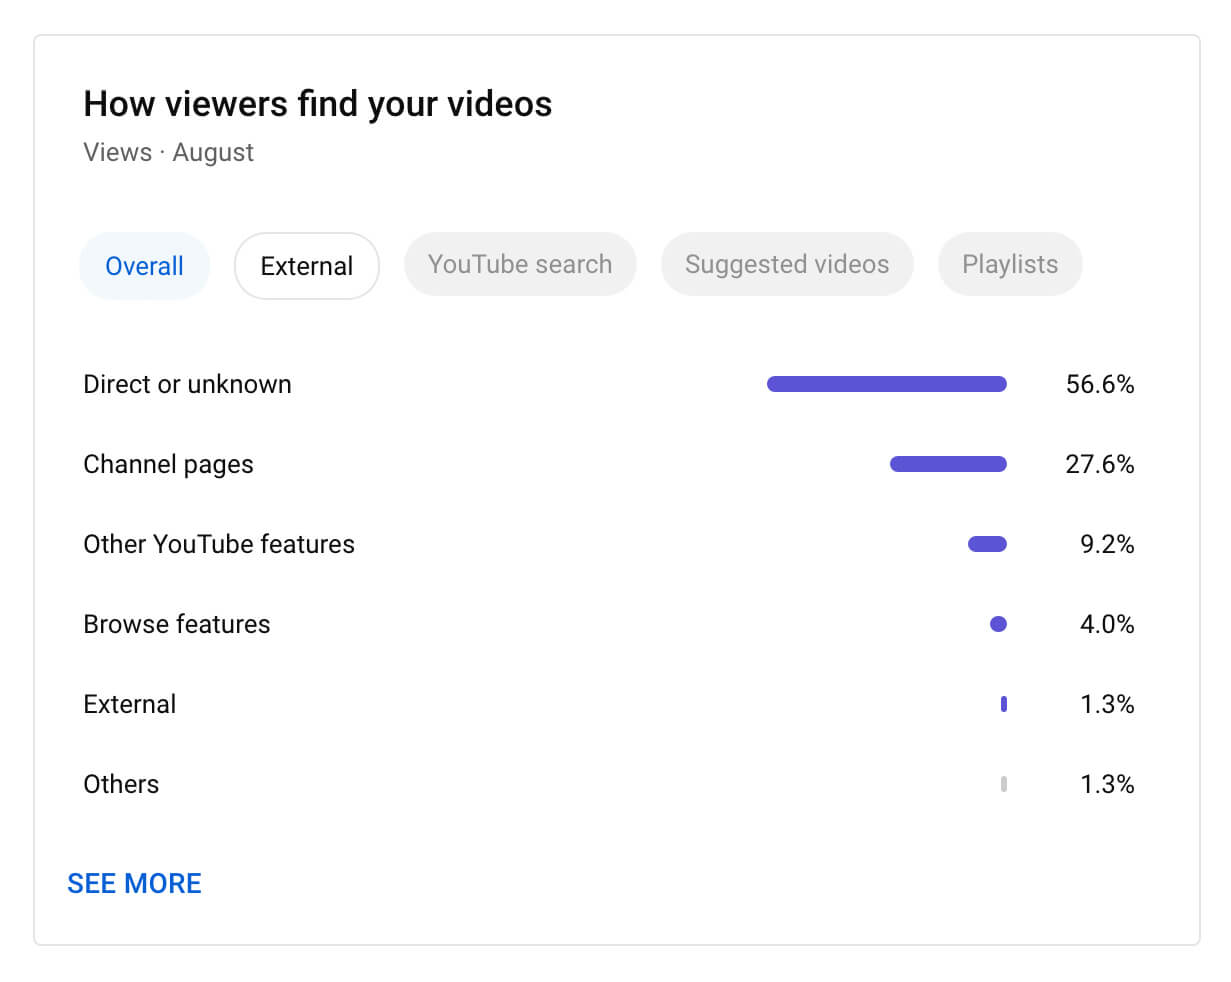
The All chip also provides an overview of how viewers access your channel, both internal and external sources.
For a detailed analysis of the sources of traffic for your channel, click the See More tab.
Select one of the chips at the top of the Content tab to view analytics for each type of content.
Video Metrics
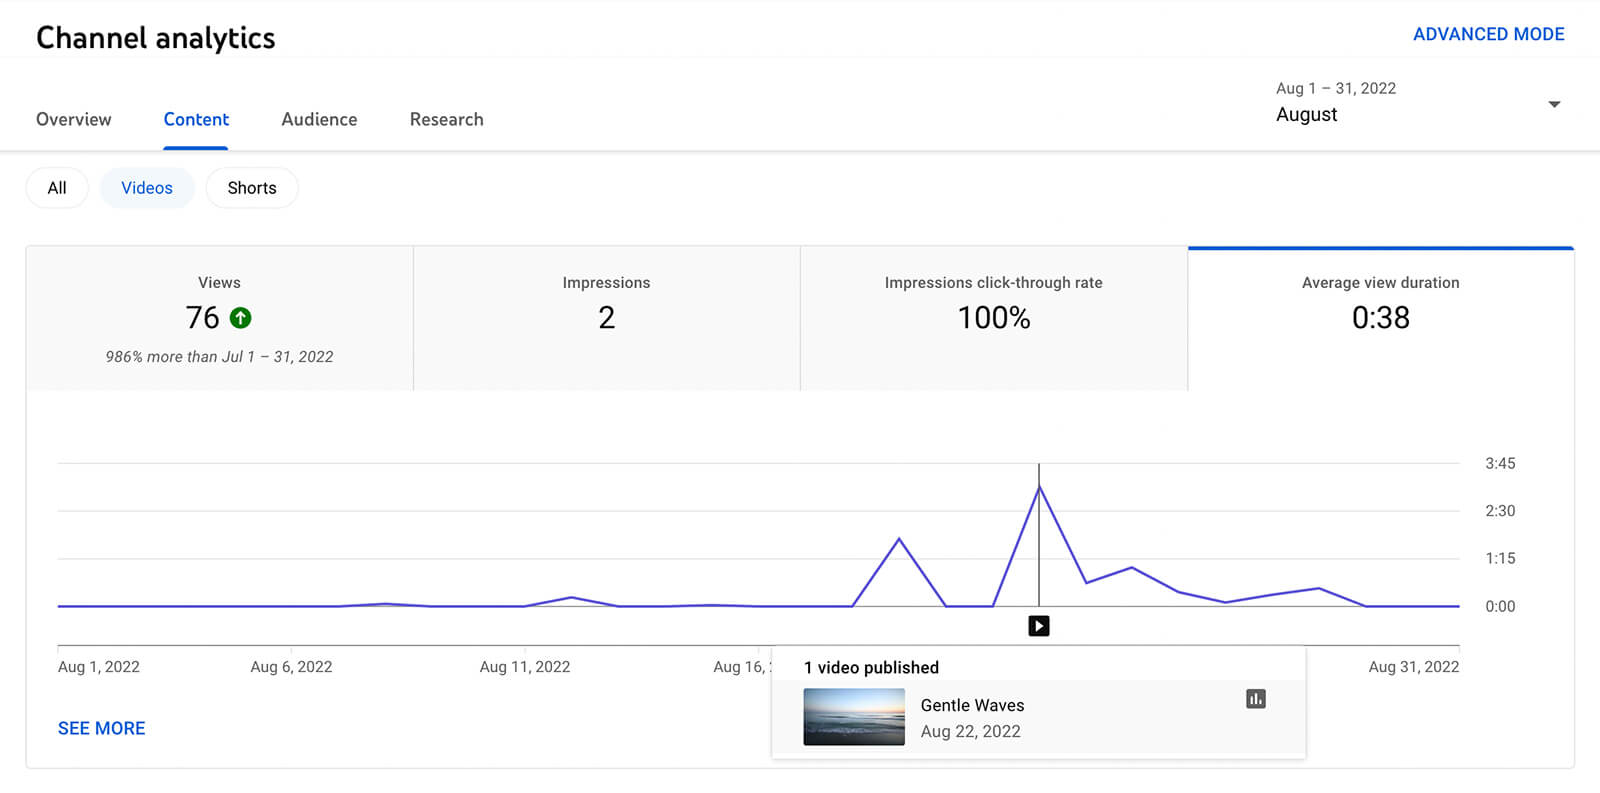
You can find an overview of the views, impressions, impression click-through rate, and average view duration at the top of the Videos chip.
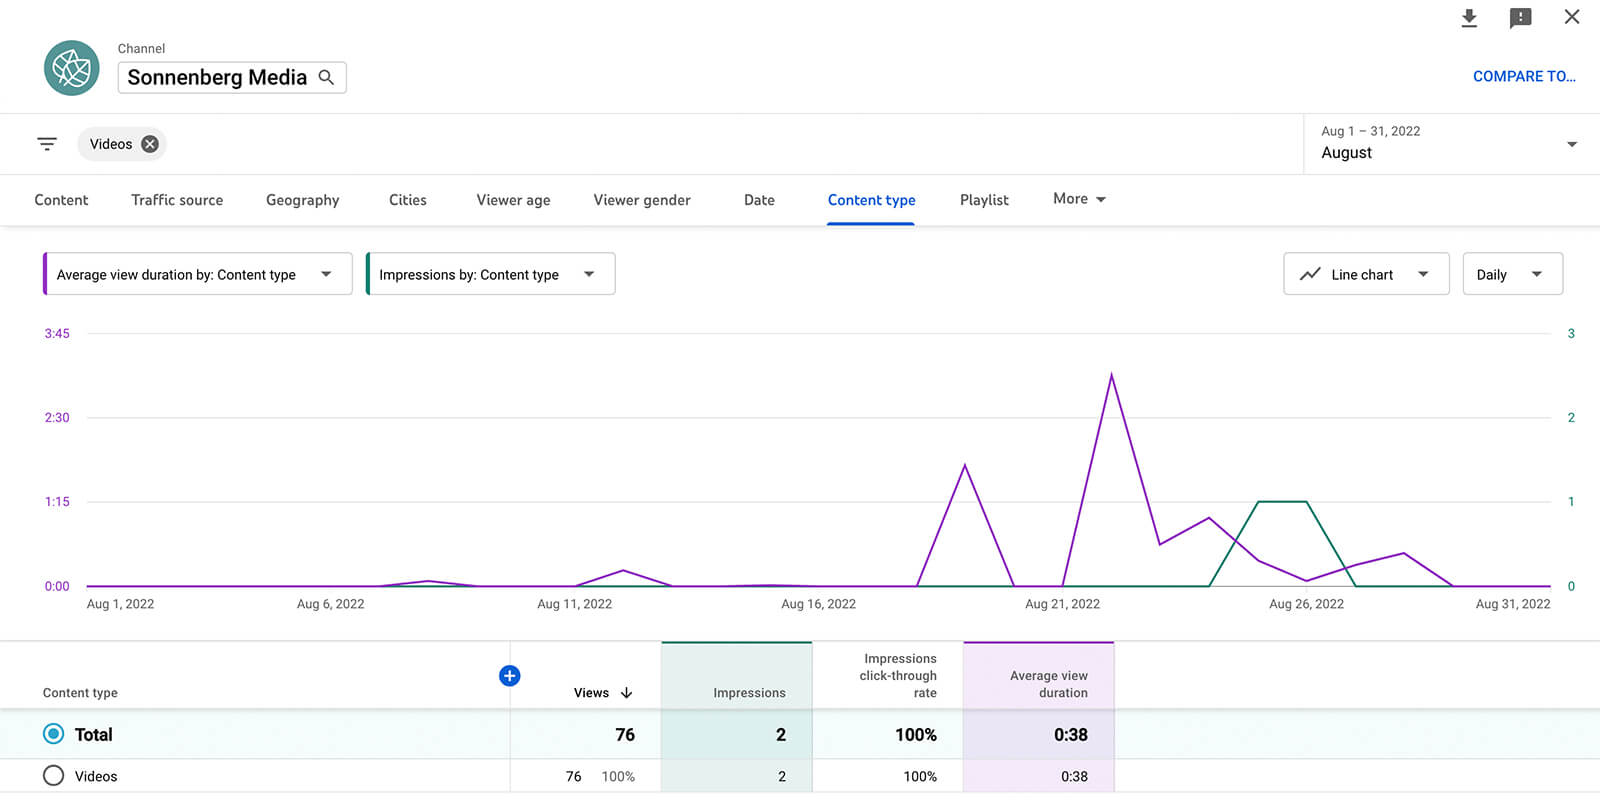
Click the See More icon in the bottom-left corner of the chart to access more information from your long-form video data. After that, choose up to two metrics to examine and look for patterns.
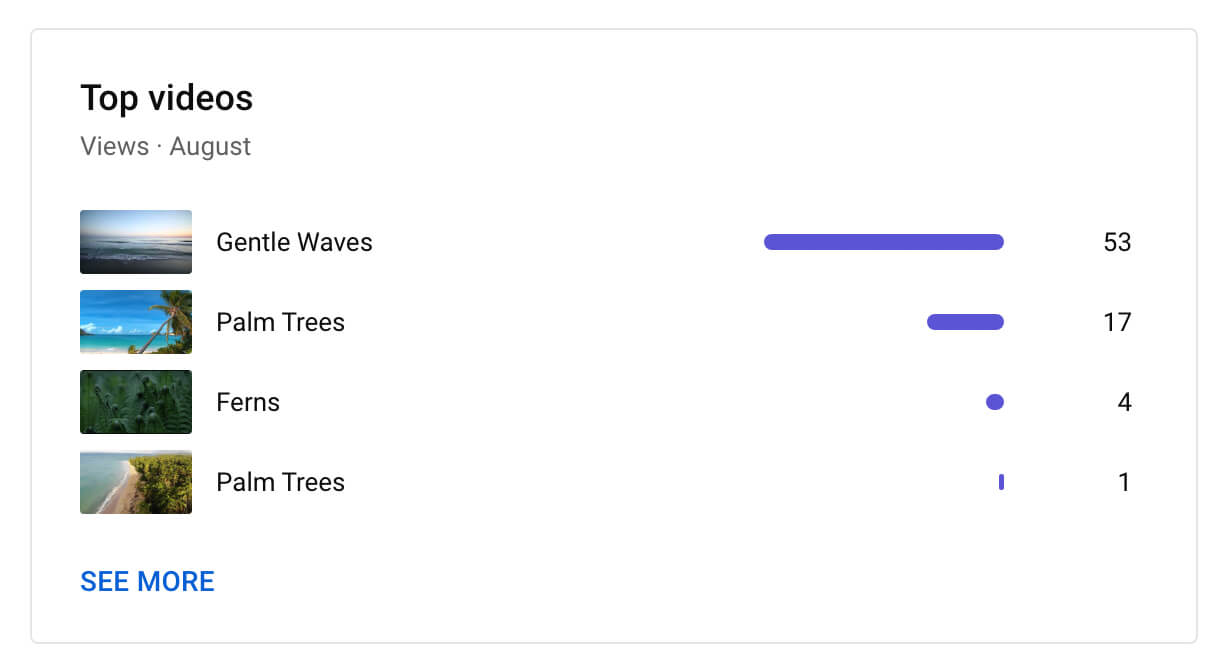
Returning to the main Videos chip, you can see the top content and traffic sources for long-form videos.
A customizable chart may be seen by expanding either panel, and you can also click on any of the top videos to view specific content analytics.
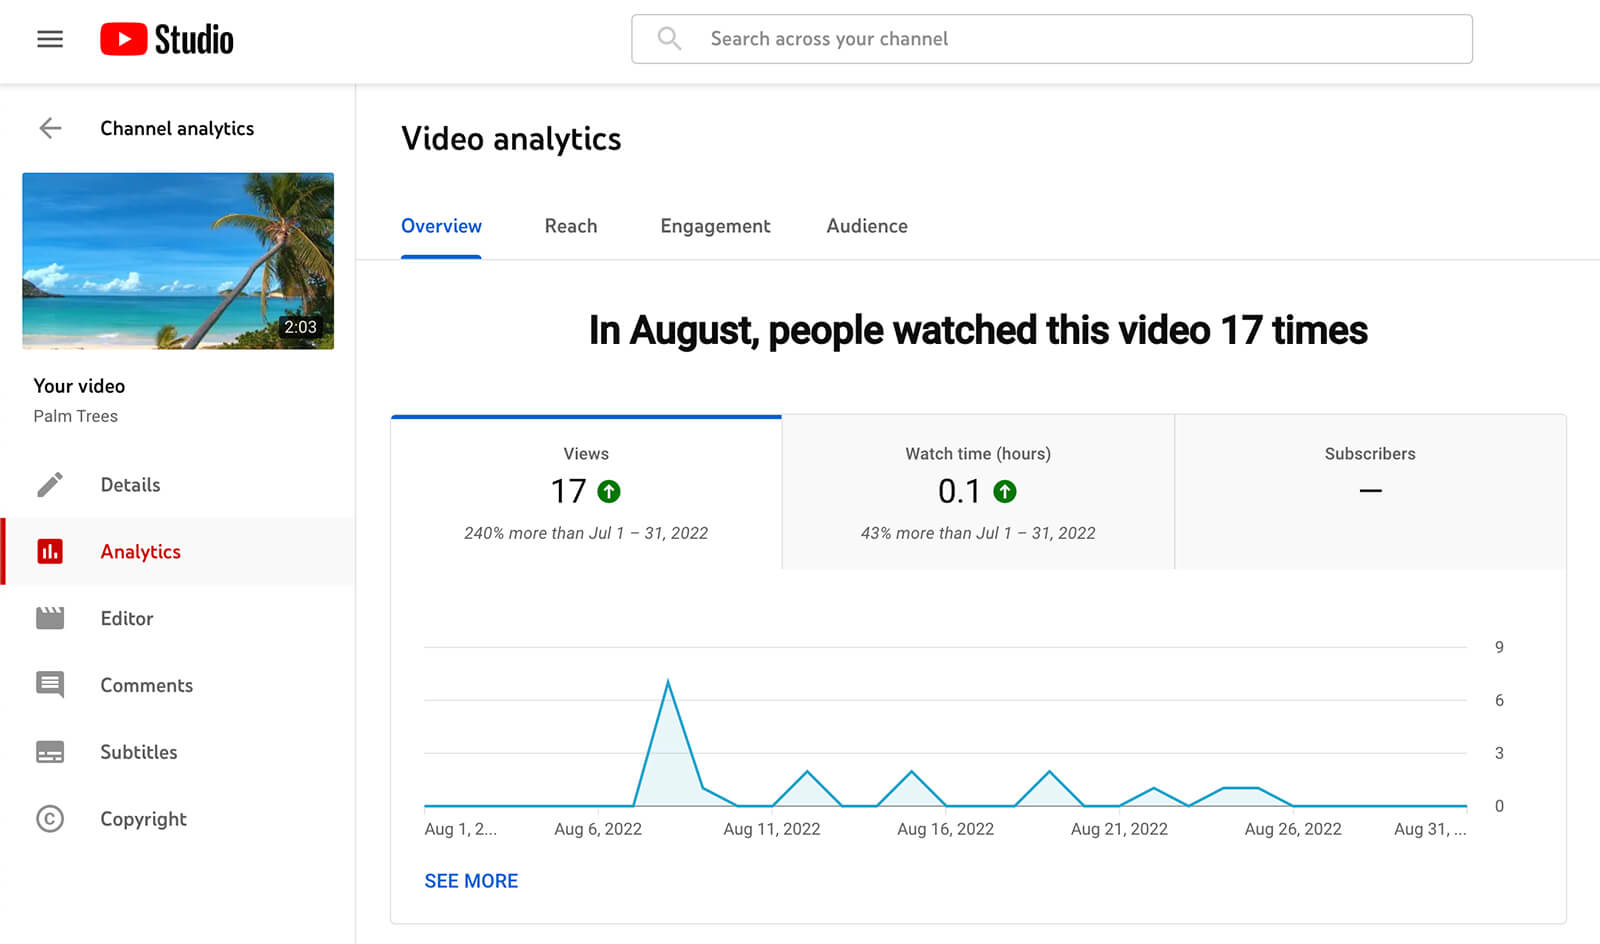
Video-level analytics have not changed, not like channel-level analytics. You may still use the Reach and Engagement sections in addition to the Overview tab to examine all of the states for individual videos.
Shorts Metrics
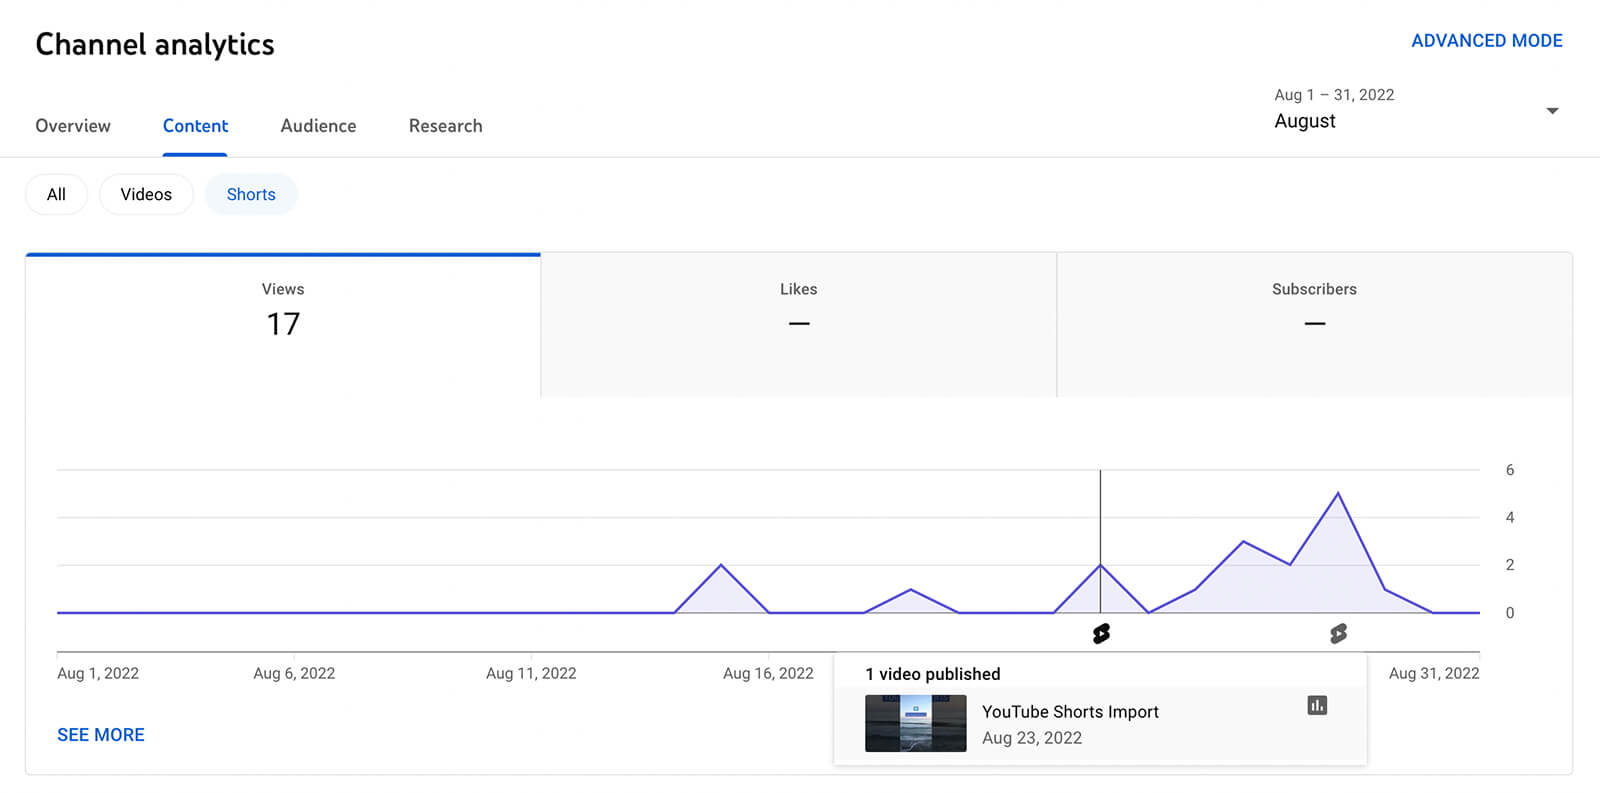
Short chip demonstrates the same data but it allows you to focus more on your short-form content. To view the impact of your shorts, click through the Views, Likes, and Subscribers pages.
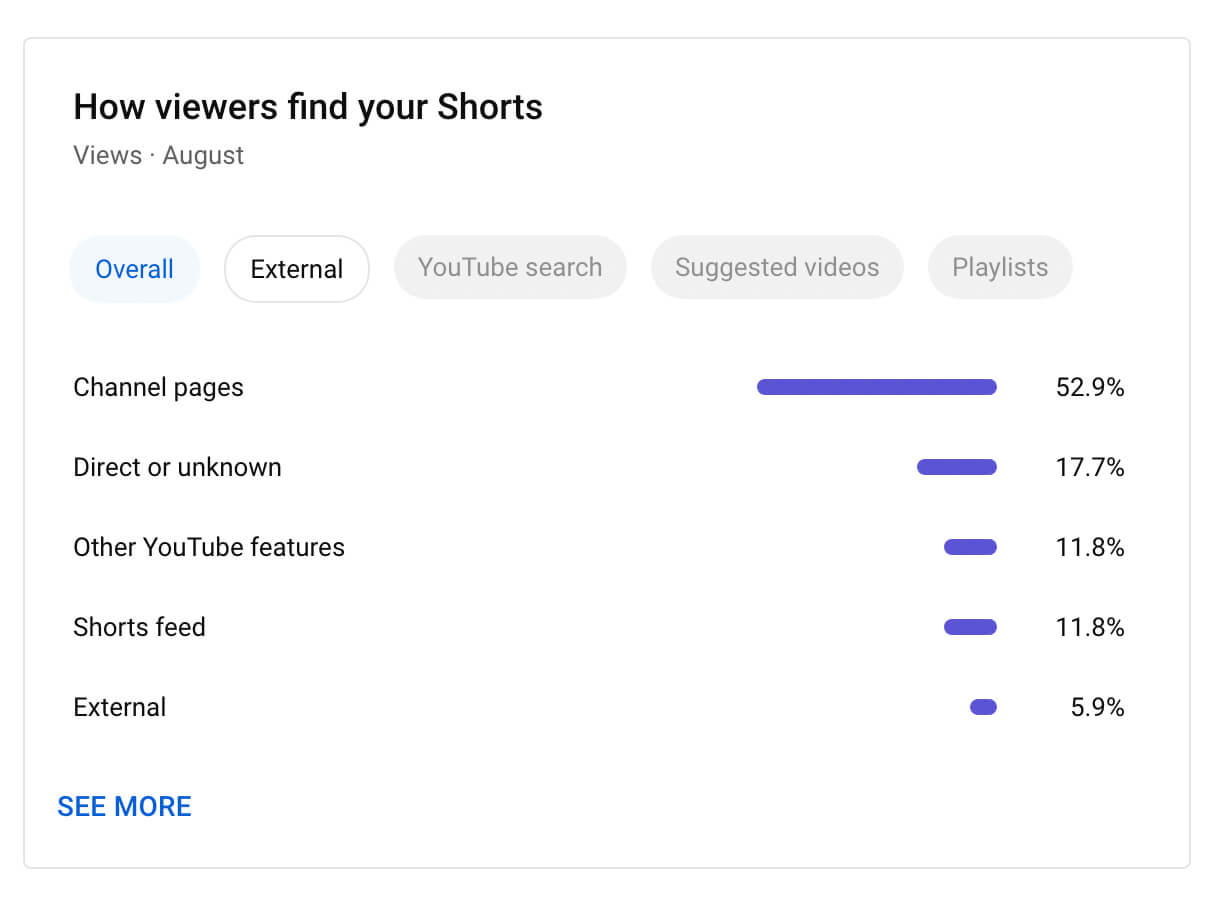
Scroll down to examine the traffic sources for your short-form content after viewing the Shorts overview.
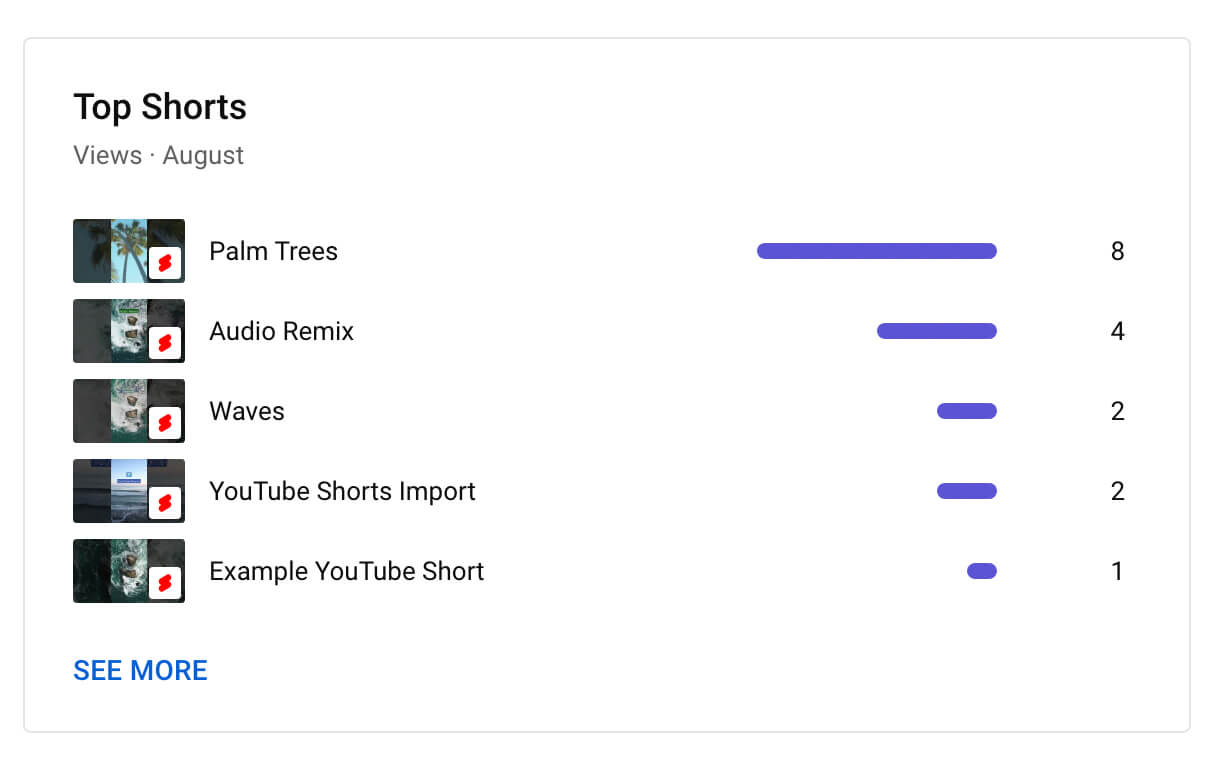
The Shorts chip provides a top content report that lists your top five shorts from the chosen time period, just like the Videos chip does. You may either click the See More link for in-depth information or any of the top shorts to access individual video analytics.
Want to know why you should use Youtube Short? Let’s find out!
Live Metrics
You’ll find a Live chip at the top of the Content tab if your team streams live content. Views, impressions, and impression CTR for each livestream you’ve hosted are simple to see thanks to the Live chip.
Want to know which of your livestreams had retained your viewers the longest? You can evaluate how your audience is participating by looking at the average view duration analytics for the stream and replays.
The Live chip features panels that show your channel’s top live streams and how people find your video, just like the other content chips do. To explore advanced analytics, click the See More option in any panel.
Please take note that you can only access the content category’s data from January 2022 when you view advanced analytics. Remove the content type filter if you want to see all of the data for your channel.
Post Metrics
You’ll also see a Posts chip at the top of the Content tab when your channel posts community content. Not only it displays impressions and other important metrics, but also allows you to examine the most popular posts by post type.
Remix Metrics
You must use YouTube Studio’s desktop application to view any sophisticated analytics, including information on playlists, cards, and end screens.
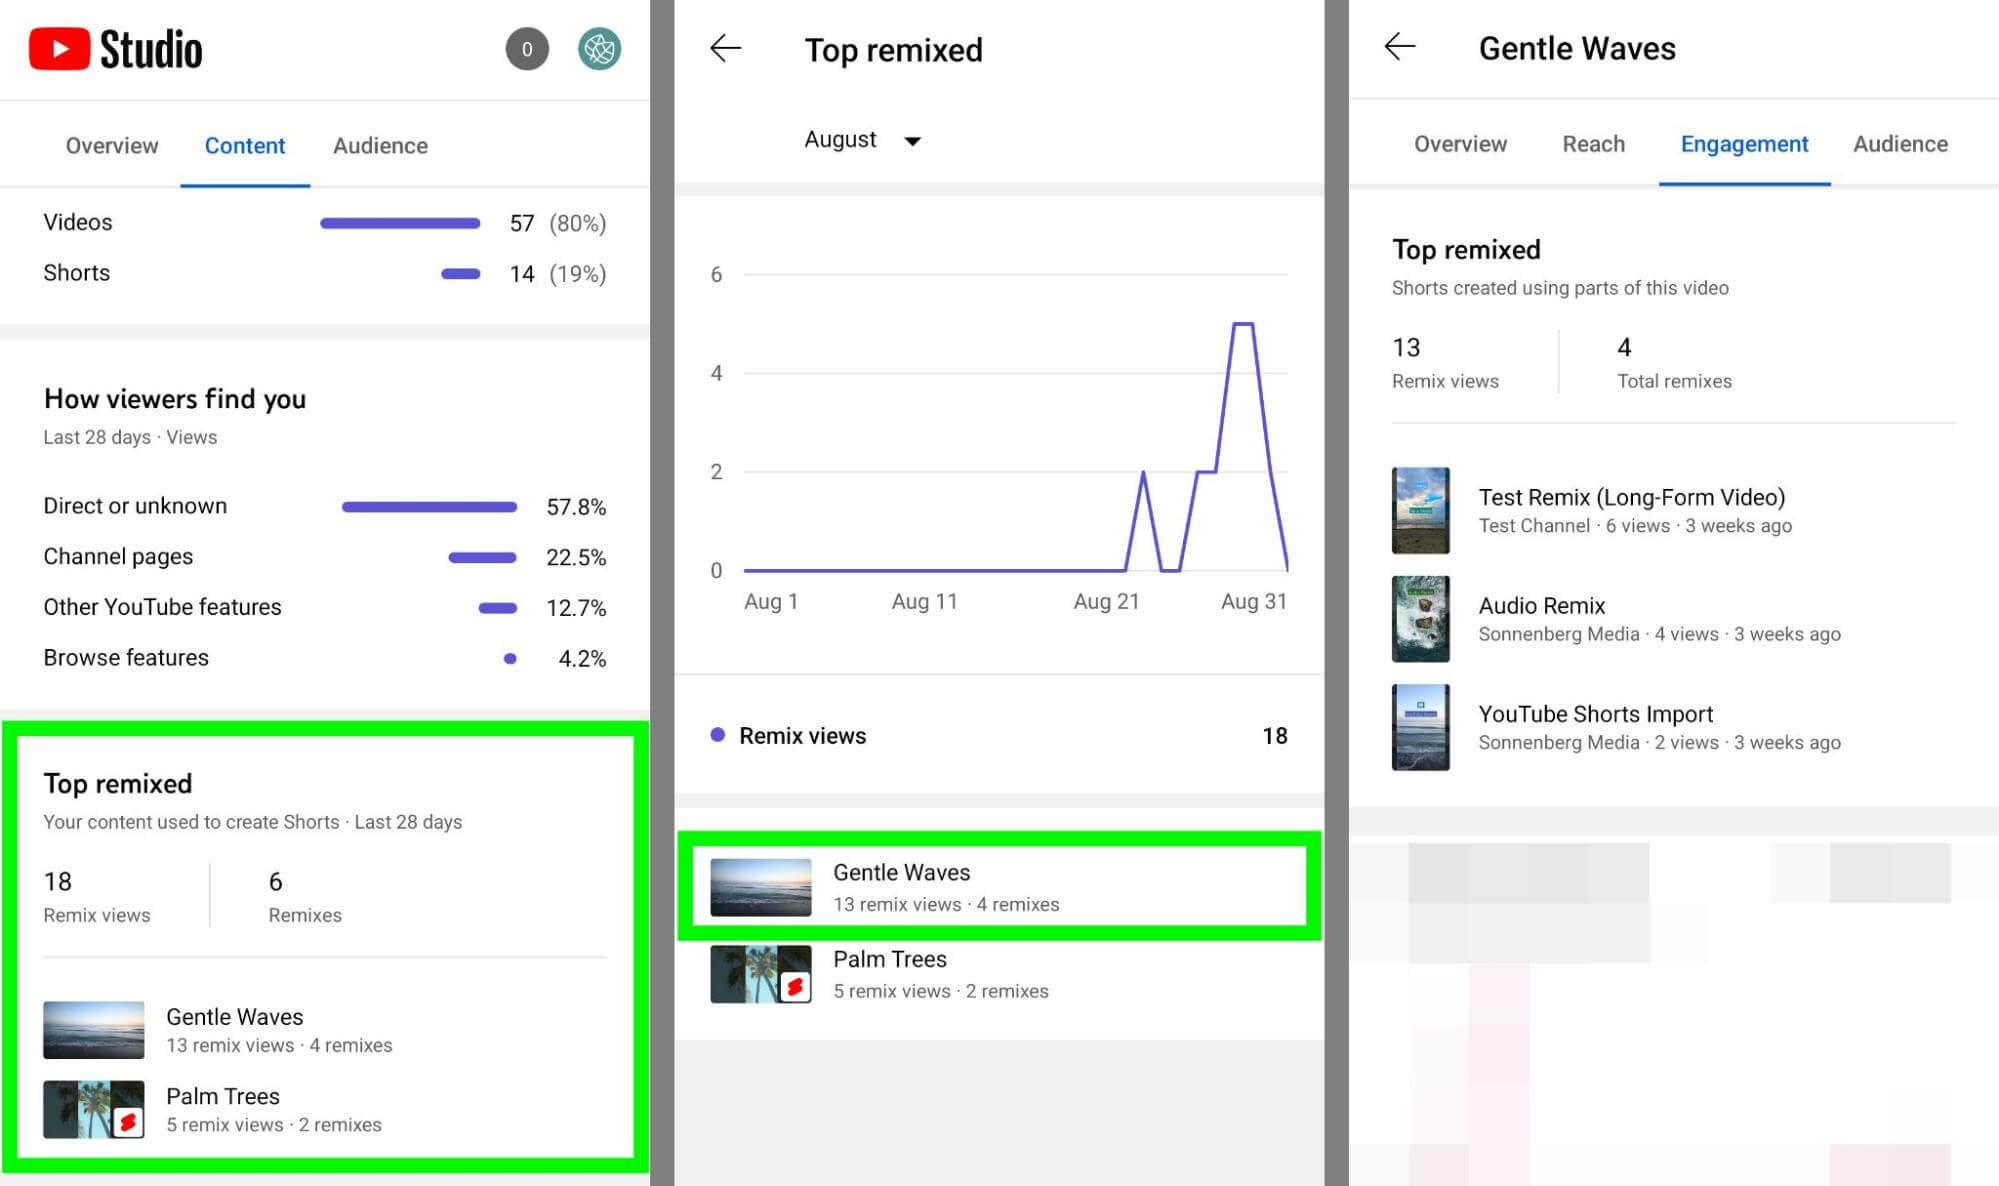
Additionally, the desktop edition of YouTube Studio lacks a particular type of data that the mobile app does. Check the Remix analytics in the YouTube Studio mobile app to discover how other YouTube users are turning your video content into shorts. It can be found at the bottom of the Content tab.
The number of remixes and the overall number of views for these videos are shown in the Top Remixed summary. It displays a time-based chart of Remix views with a list of content that other users have remixed.
After this, you can tap any video and choose the video-level Engagement section to check the Remix details. To view any remix on YouTube, simply tap it. This will allow you to see how other channels have interacted with your content.
Let’s have a look at how to use Youtube Studio Analytics to effectively utilize your content and better your performance!


