
Continue to learn more about how to use Youtube Studio Analytics to better your Youtube channel’s performance.
Are you unsure about the effectiveness of your YouTube videos, remixes, or shorts? Are you struggling to find the YouTube metrics you need? All are important data served to achieve the highest efficiency in managing your Youtube channel. So is there a tool that can serve that? You’ll discover how to analyze any kind of YouTube content in this article using YouTube Studio Analytics.
#2: Auto-Translate Metrics
It’s crucial to make video material so that the target audience can understand your idea. You can determine whether people are using closed captions by using YouTube Studio’s subtitle statistics (CC). Additionally, you can tell which language settings they are applying.
Channel-Level Auto-Translate Metrics
Access the YouTube Studio dashboard and choose Analytics from the left-hand menu. After this, you to see your channel’s CC analytics. The Top Subtitle/CC Languages panel can be found by selecting the Audience tab. The percentage of viewers who use each subtitle language setting can be seen here.
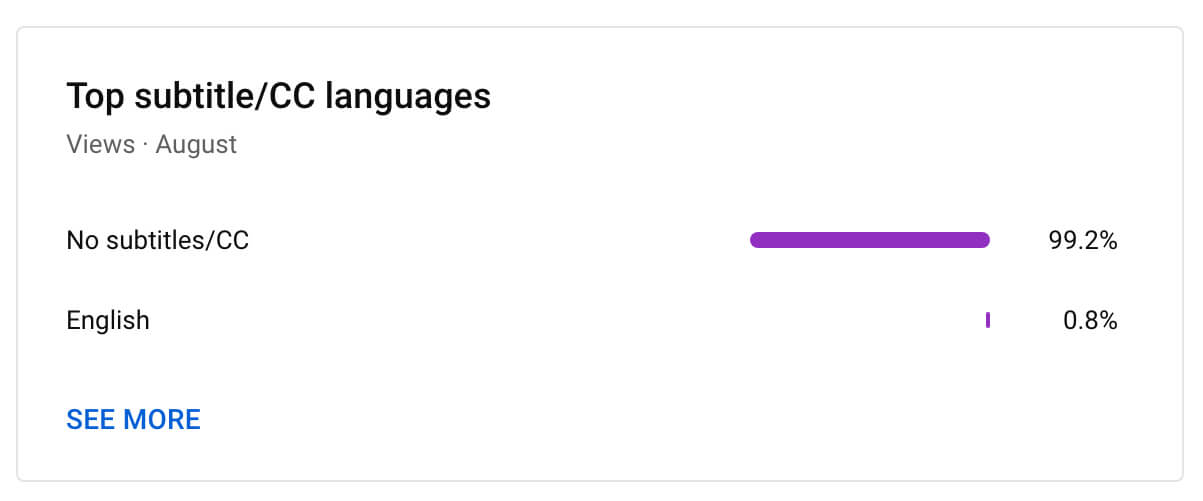
To display the subtitle metrics for your channel as a chart, click the See More link. Check the box to the left of your selections to isolate one language or to compare two languages.
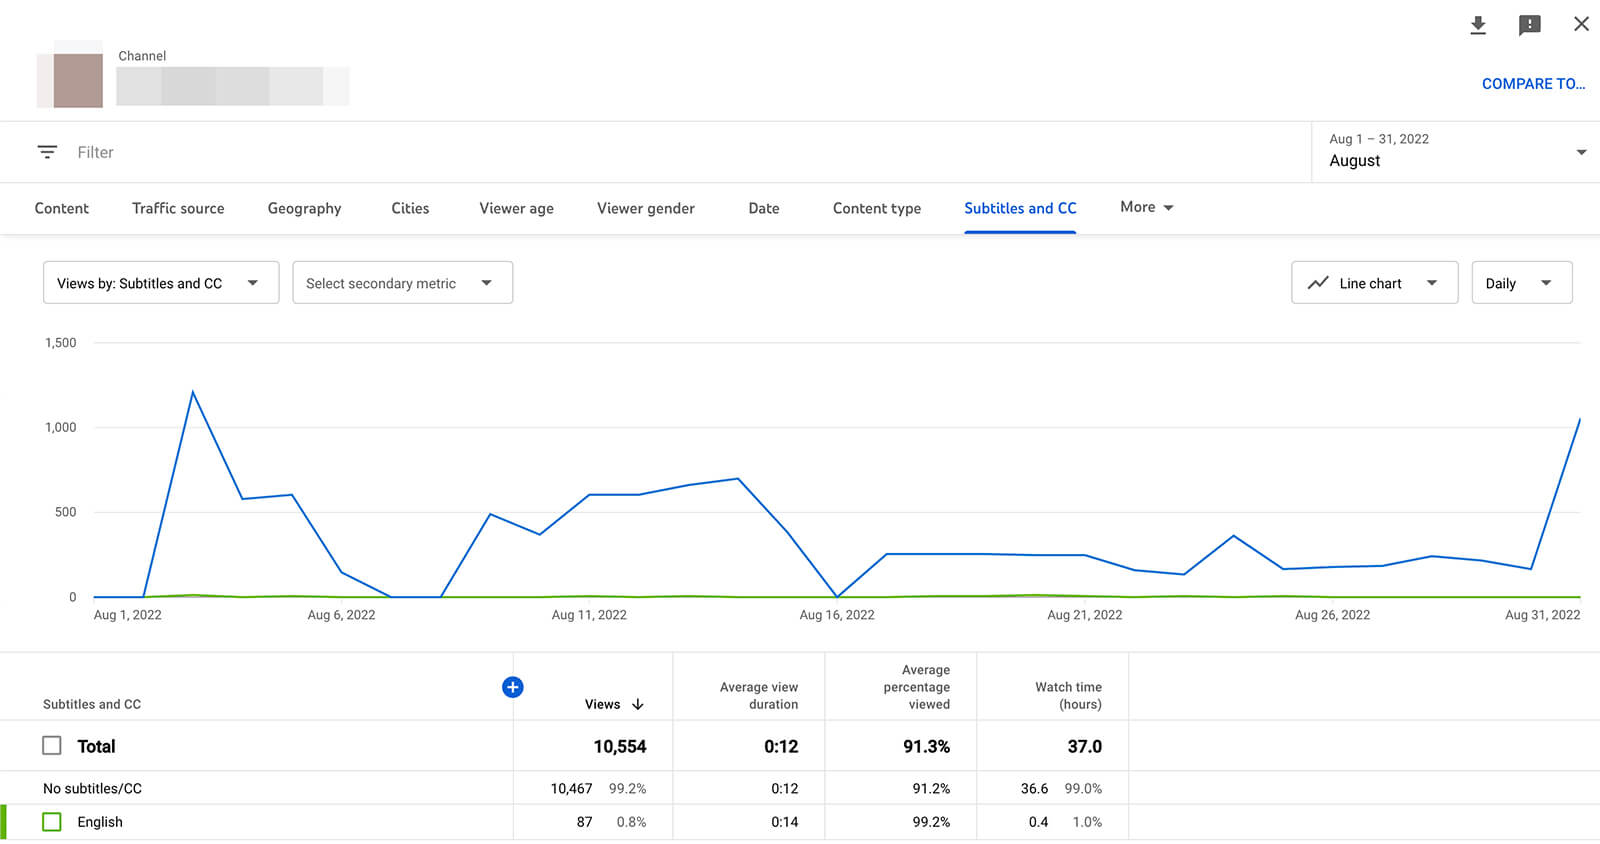
The Subtitles and CC chart shows Detailed metrics for every language. You may observe the average view time and average view percentage. With these, you can decide more wisely what captions to add to the videos.
Video-Level Auto-Translate Metrics
Looking for the most popular subtitle languages for specific videos? Choose the Content tab on your YouTube Studio overview page. Go to the Audience tab of any video you’ve chosen. After that, scroll down to see the video’s Top Subtitle/CC Languages page.
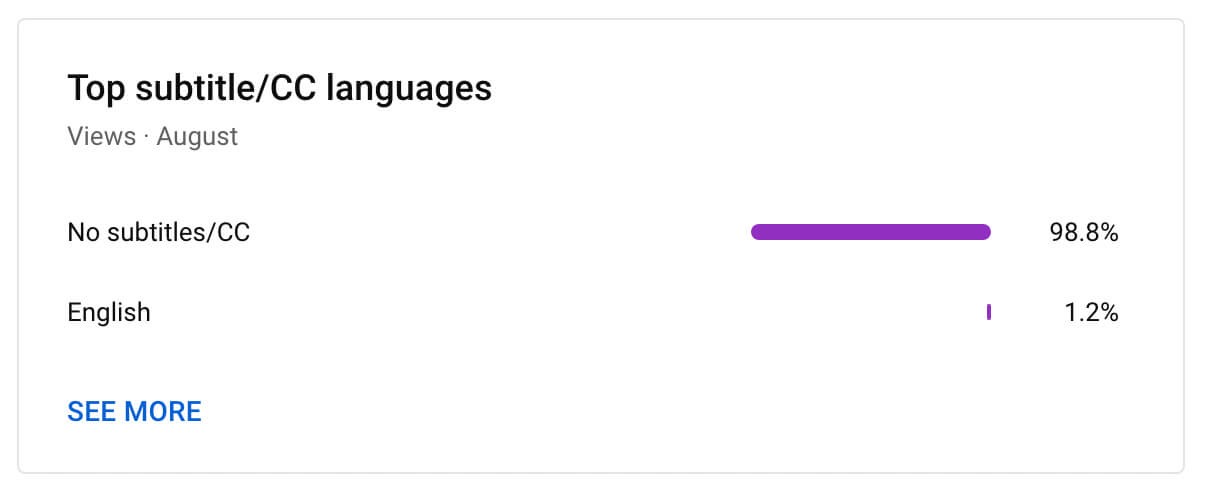
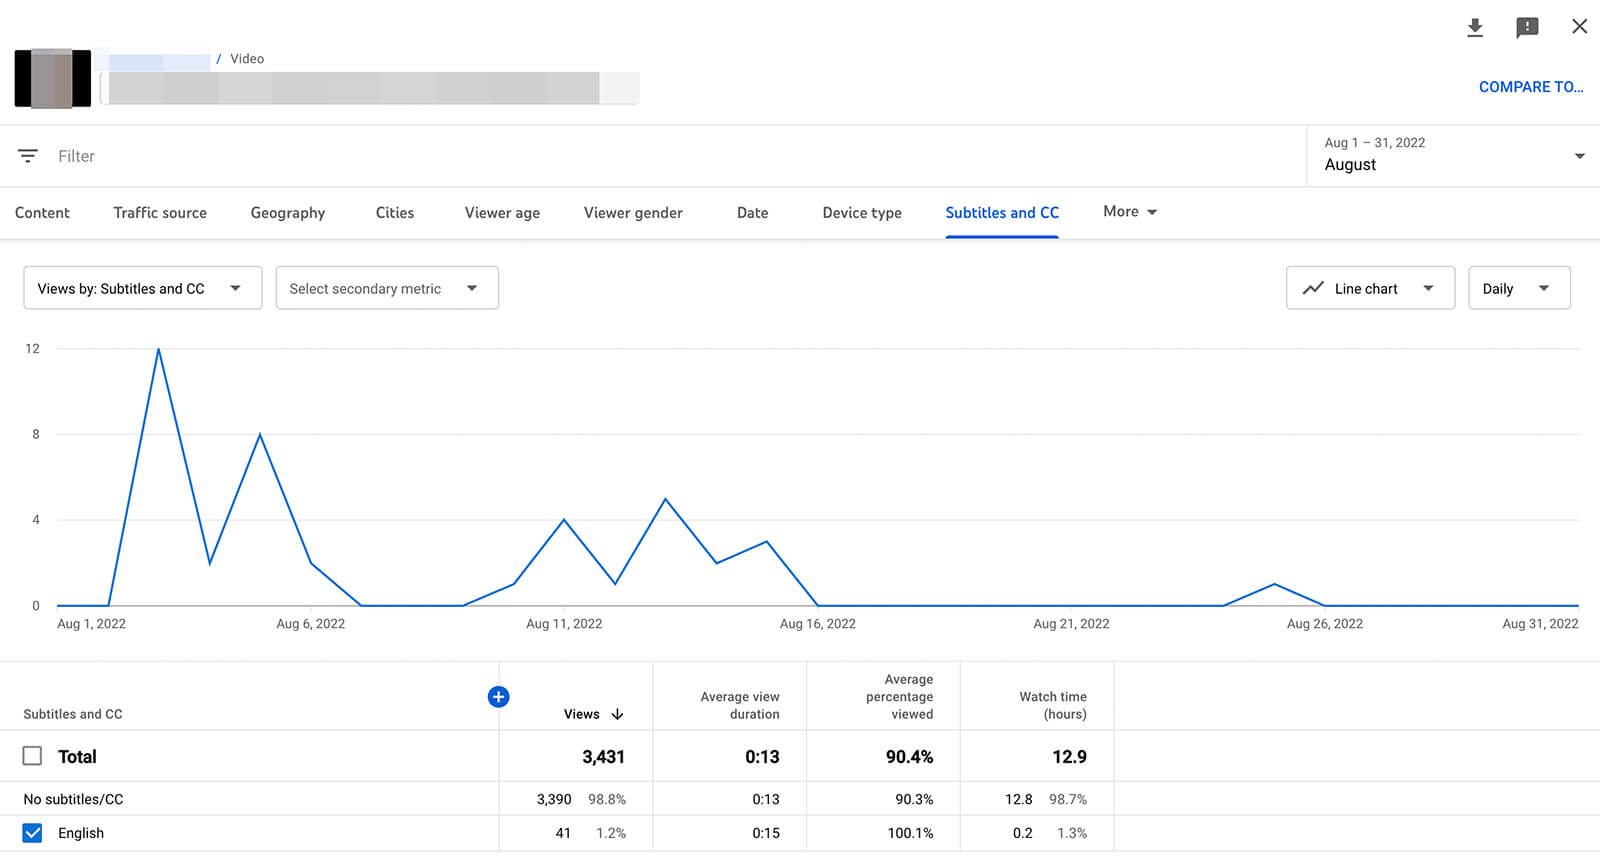
The video-level panel offers specific metrics for each language. For more nuanced insights, you can also focus on a language or compare two or more.
The YouTube Studio mobile app only shows a percentage breakdown. Use YouTube Studio’s desktop version to view charts and trends.
Learn more about how to use Youtube Analytics!
#3: Popular Segments Graph
You may learn a lot about what the audience enjoys and dislikes using Youtube Studio. However, if you produce long-form content, it may not necessarily give you enough information. Finding the sections that connect with your audience the most is a useful strategy.
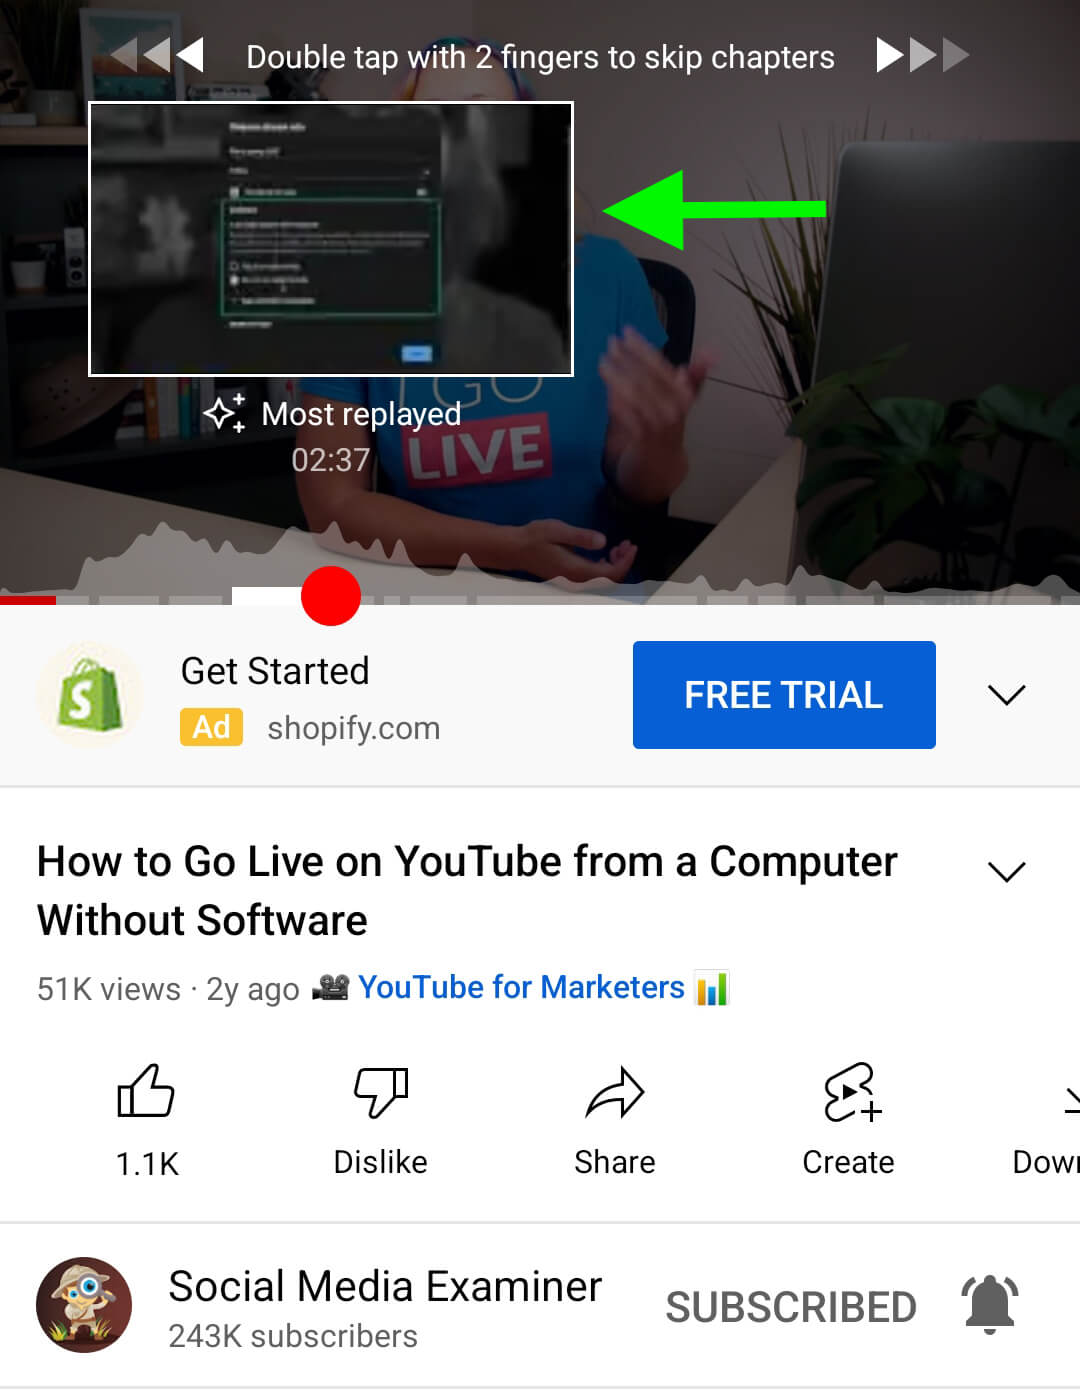
You can determine the video segments replayed the most using YouTube’s popular segments graph. You can open any video on YouTube, both on the mobile app or desktop version to get this graph. Then, on a PC, hover over the video or, on a mobile app, drag the scrollbar.
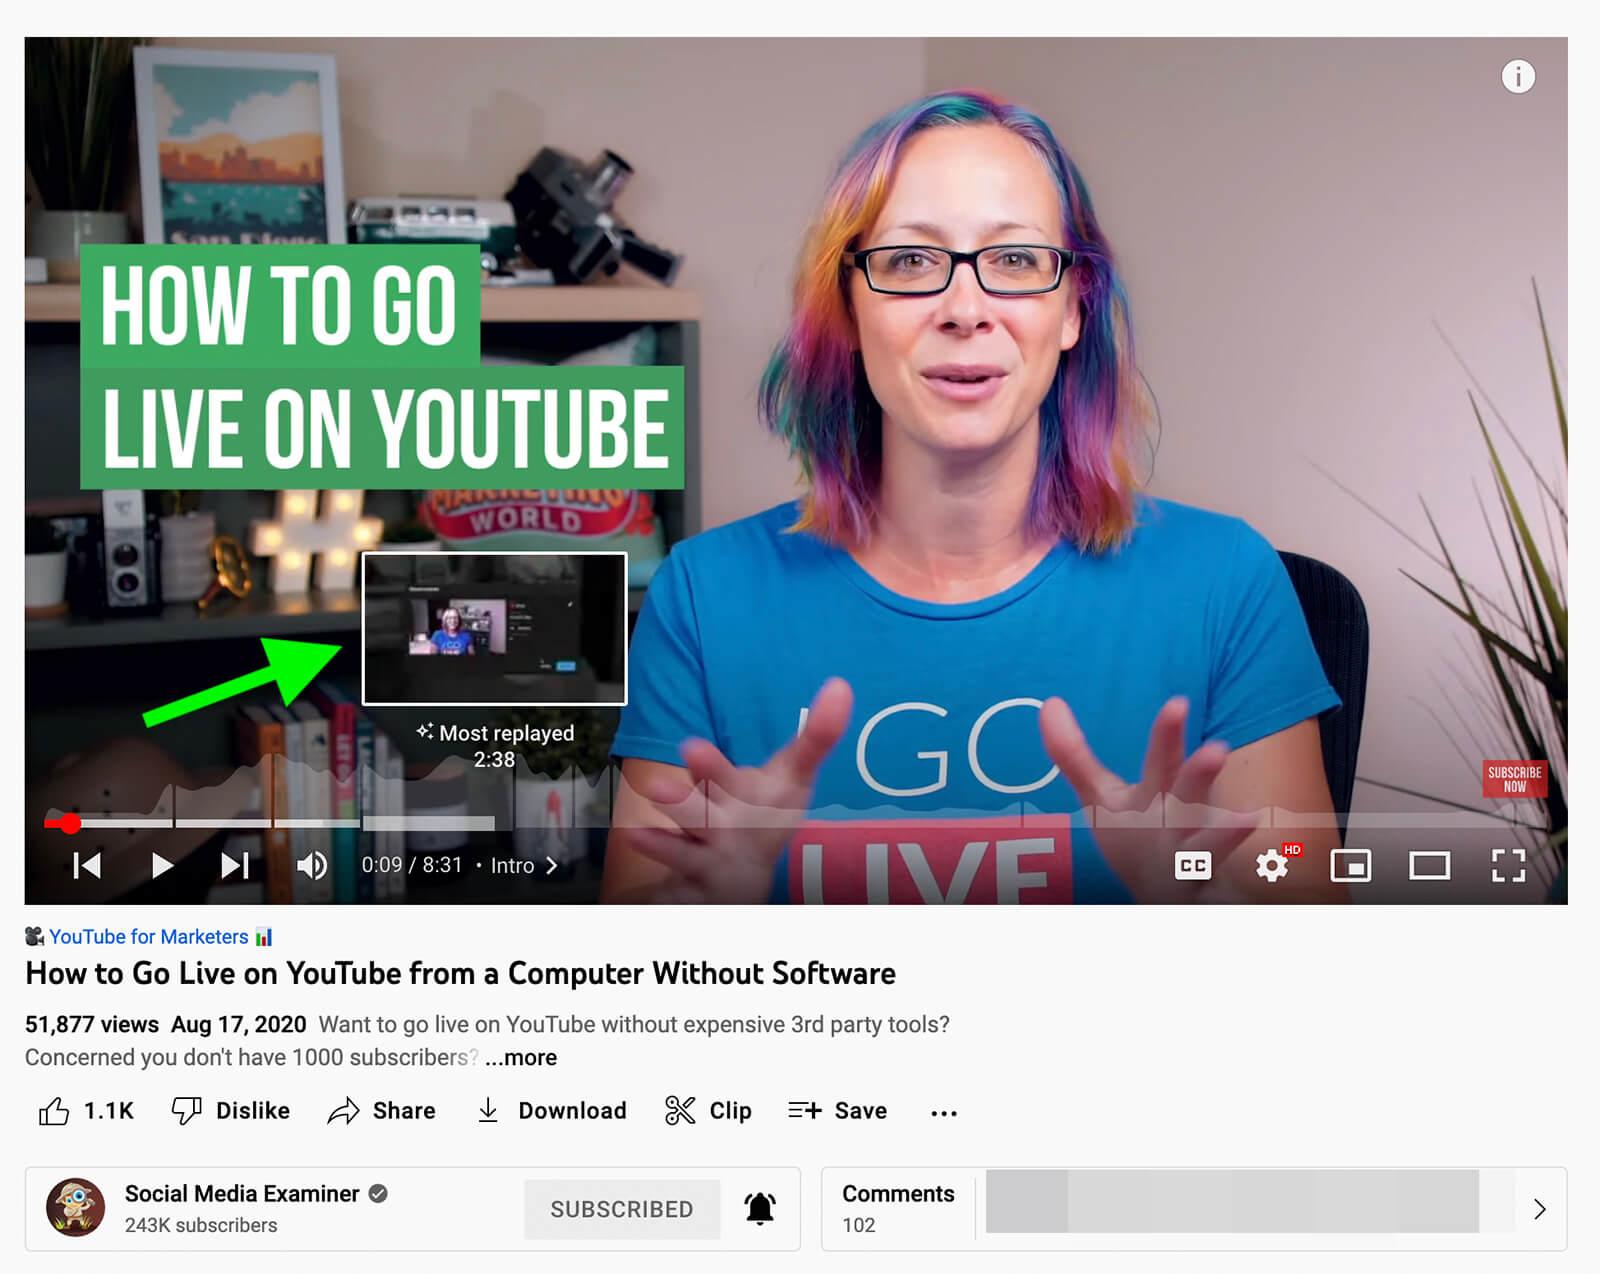
Videos provide a graph, with peaks indicating the most watched (i.e., frequently replayed) parts. YouTube shows a Most Replayed label to indicate the most watched section.
Benefits of the Popular Segments Graph
You can learn more about what viewers found most useful or interesting. This appears on YouTube for all videos is one of its main advantages.
That implies that you can use this tool to research the content of other channels as well. To improve your content, you can identify the most replayed parts of your competitors’ videos.
Drawbacks to the Popular Segments Graph
This feature’s biggest drawback is that it only appears after YouTube has accumulated enough information. That implies that it might not be available for all of your videos.
When introducing this feature, YouTube claimed that most channels’ watch times had not decreased. However, watch time is still a measure you’ll want to keep an eye on it.
Alternatives to the Popular Segment Graph
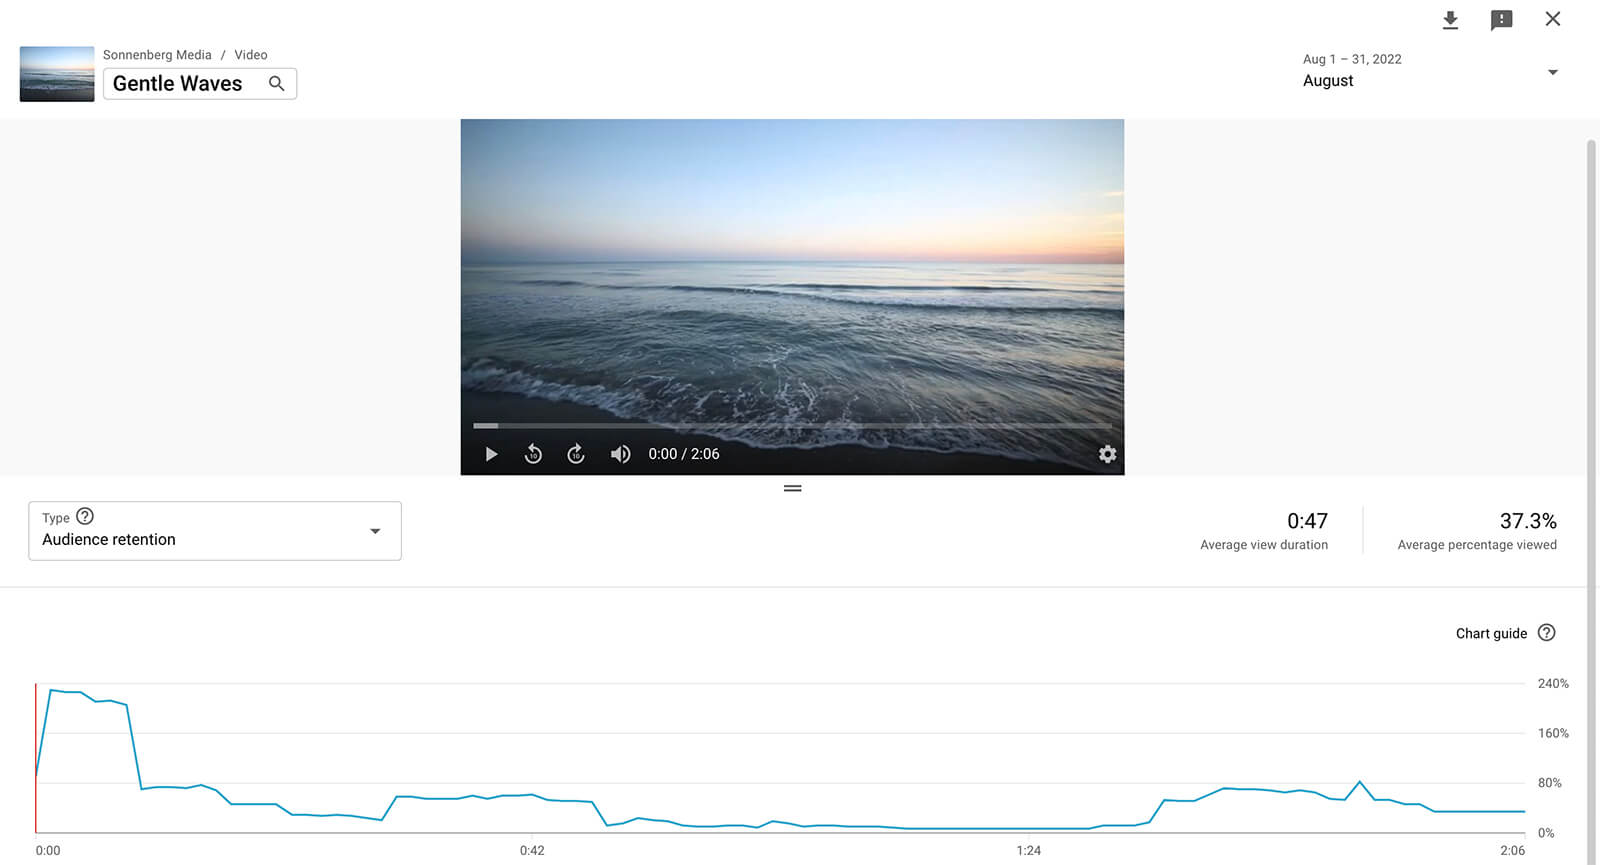
Check your audience retention numbers in YouTube Studio to learn more about popular parts of any videos. The Overview page of any video show this chart. The audience retention graph also displays when viewers started and when they got out.
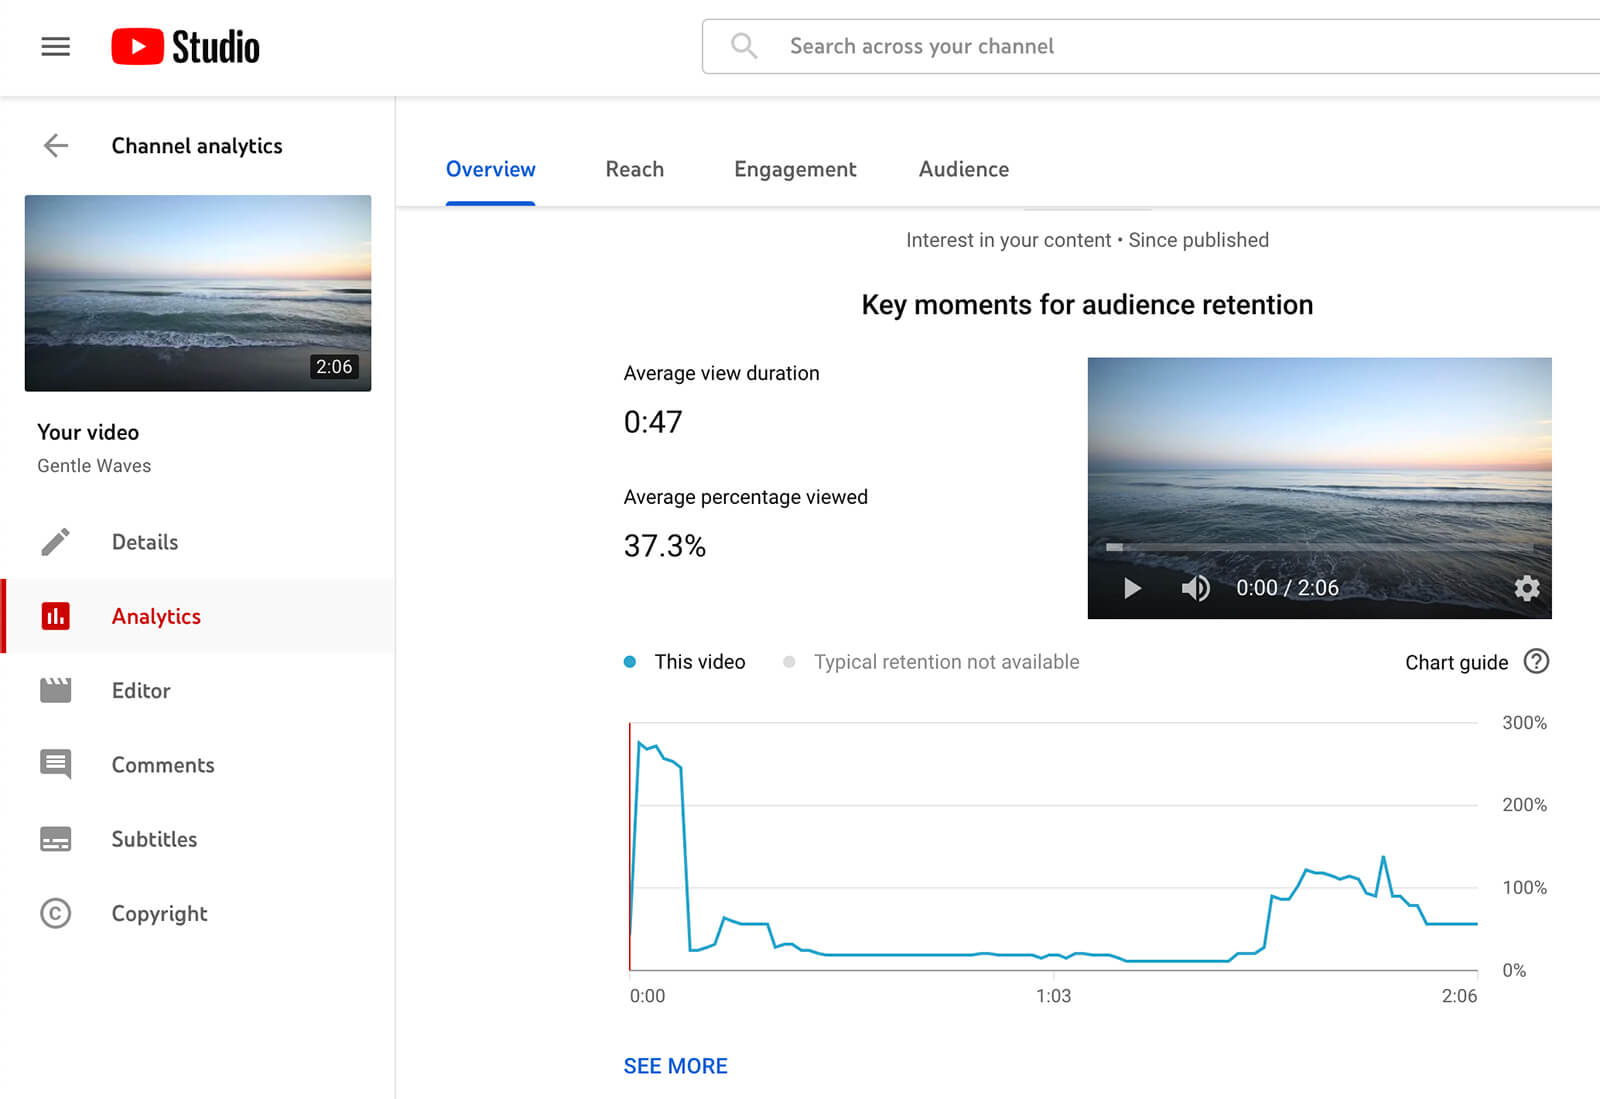
From there, you may discover what draws viewers in and what makes them click away. Then you may use the hooks and subjects that are most effective for your audience in later video content.
Conclusion
The redesigned YouTube Studio analytics can make your job a lot simpler. These metrics allow you to track the success of your channels and content. With this, you can use your knowledge to create YouTube videos that perform better.