TikTok: Beyond Teenagers. From its origins as a teen-centric platform, TikTok has evolved into a crucial marketing channel, extending its reach far beyond the teenage demographic. Boasting over a billion monthly users, nearly one-third are over 35. This shift makes TikTok a significant player for brands of all sizes. Harnessing TikTok analytics tools is key to developing a robust strategy, offering valuable insights into effective approaches for your business. Whether you’re a newcomer to TikTok or an established brand, analytics eliminate guesswork and help tailor content strategies to match your audience’s preferences.
What are TikTok analytics tools?
What do TikTok analytics entail?
These tools enable performance tracking on TikTok, offering insights into the most active videos.
Beyond surface-level data, they play a crucial role in shaping your TikTok marketing strategy by revealing what resonates with your audience. Consistently assessing key metrics for your TikTok account promotes strategic growth, eliminating reliance on mere optimism.
25+ Essential TikTok Metrics
Metrics for TikTok Account
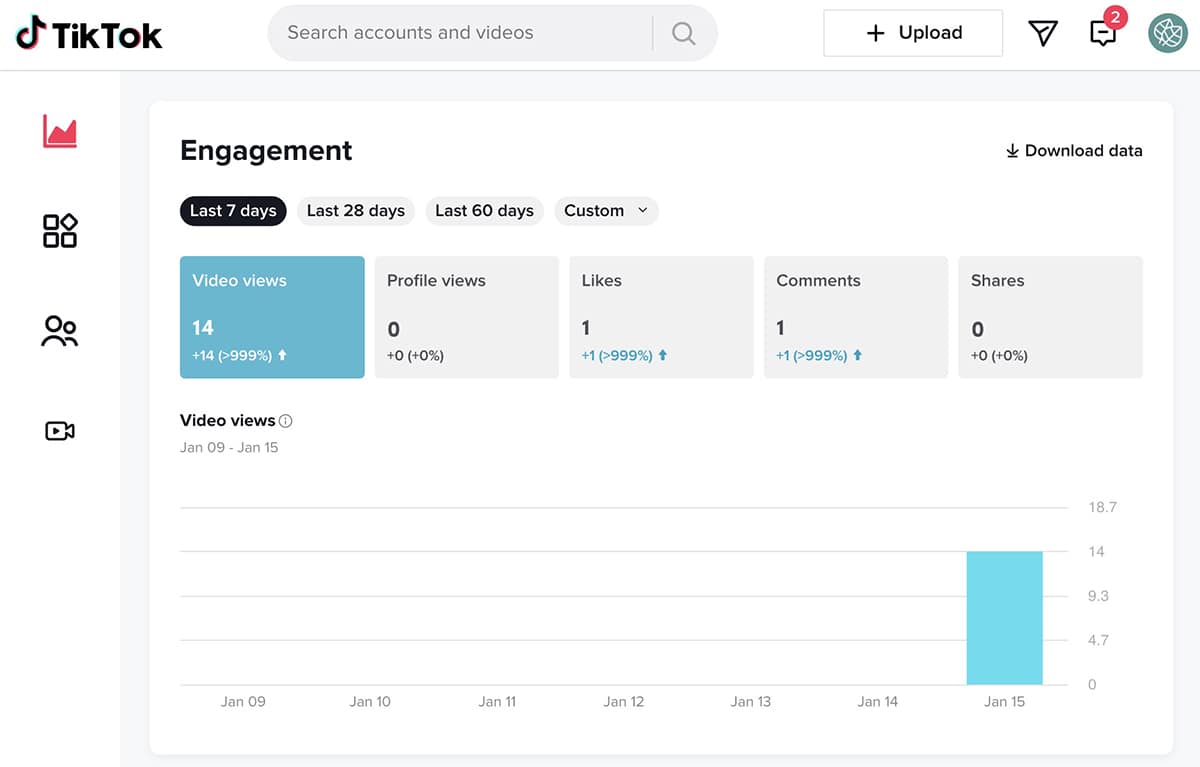
1. Video Views: Total times people see your account’s videos in a given period.
2. Profile Views: Number of times your profile was viewed, indicating brand interest.
3. Likes: Count of likes your videos received in the selected date range.
4. Comments: Number of comments your videos received in the selected date range.
5. Shares: Number of shares your videos received in the selected date range.
6. Content Frequency: Number of videos shared in the selected date range.
Metrics for TikTok Content (Individual Videos)
7. Post Views: Times a TikTok video has been viewed.
8. Post Likes: Total likes a post has received.
9. Post Comments: Total comments a post has received.
10. Post Shares: Number of times the post has been shared.
11. Post Engagement Rate: Calculated as [(Likes + Comments + Shares + Content clicks in videos) / Viewers] * 100. (Hootsuite Analytics can calculate this for you.)
12. Post Average Watch Time: Average time viewers spent watching the video.
13. Video Completion Percentage: Percentage of viewers who watched the entire video.
14. Video Reach: Total number of individual users who watched the video.
15. Traffic Sources: Where people found your video, including the For You feed, profile, Following feed, sounds, searches, and hashtags.
16. Video Views by Region: Top locations of viewers for the post. Useful for assessing post or campaign reach for specific locations.

Metrics and Demographics for TikTok Follower
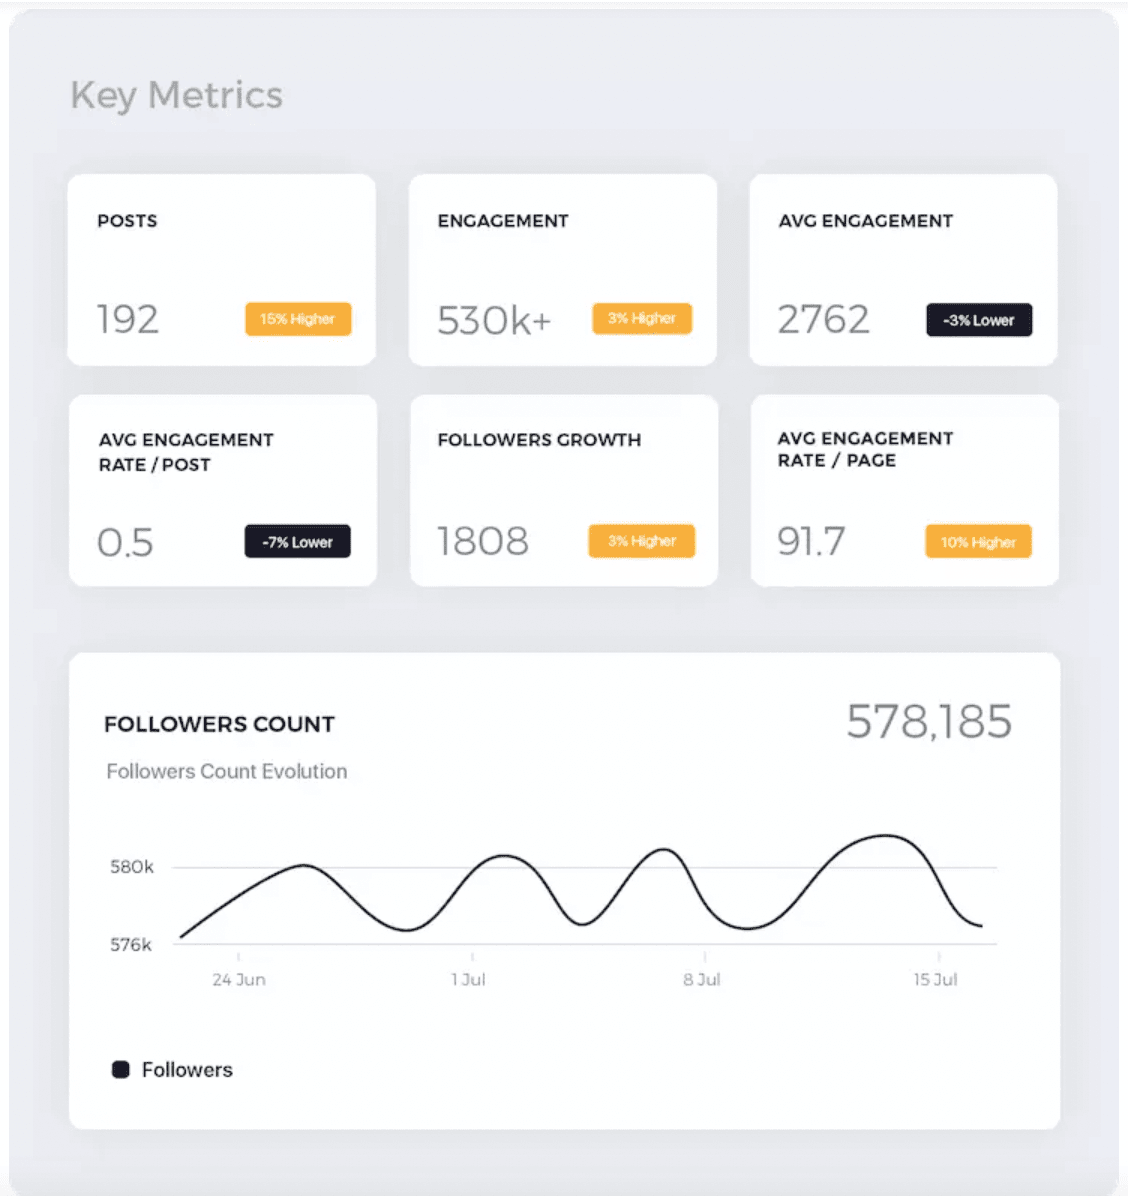
17. Follower Count: Current total number of followers.
18. Net New Followers: Overall increase or decrease in follower count during the selected period.
19. Gender Distribution: Breakdown of stated gender identities among followers, providing insights for audience personas.
20. Country Distribution: Ranking of follower locations by country (TikTok Analytics identifies as “Top Territories”), useful for localized content and promotions.
21. Follower Activity: Times and days when followers are most active on TikTok, guiding optimal posting times based on goals.
Metrics for TikTok Live
22. Total Views: Overall viewership during live videos in the selected date range.
23. Total Time: Duration spent hosting live videos in the selected date range.
24. New Followers: Number of new followers gained during live video sessions in the selected date range.
25. Top Viewer Count: Peak number of users viewing your live video simultaneously during the selected date range.
26. Unique Viewers: Number of users who viewed your live video at least once, regardless of replays.
27. Diamonds: Earned when hosting live videos (18+), virtual gifts like “Diamonds” can be exchanged for real money through TikTok. This metric shows diamonds earned in the selected date range.


