The basis of every effective Instagram marketing campaign is Instagram analytics. Data is the basis for all successful marketing decisions. There is plenty of data to inform you what is and isn’t effective on Instagram, as well as give ideas for creative approaches you might want to try. Where can you find the Instagram analytics data to help you optimize your plan? What does it all mean, then? In this blog, we break everything down and give you a basic guide to Instagram Analytics.
Instagram Analytics
You may view important metrics and data about your Instagram performance using Instagram analytics tools. These statistics can be very general (such as the number of times a post was seen or liked) or very detailed (such as the time when your account’s followers are most likely to be online).
The only way to create a successful Instagram strategy is to monitor the data you can access through Instagram analytics. Without data tracking, you can only make guesses about what will succeed.
You might get lucky and succeed in certain ways based just on your intuition. However, you’ll never be able to test, improve, or develop your skills without the support of solid numbers.
14 key metrics of Instagram Analytics
Instagram analytics may offer a wide range of data. So where do you even start? We have picked out the 15 most crucial metrics as prescribed below:
Instagram Account
Follower growth rate: How quickly your followers are increasing or decreasing. Nothing else on Instagram has a greater influence on organic reach.
Engagement rate: The number of engagements determines the percentage of followers or reach. This serves as a standard for evaluating how well your content is engaging with viewers and inspiring them to take action.
Website traffic: How many people visit your website after seeing your Instagram post. If you want to improve your Instagram ROI and link your Instagram activities to off-platform objectives, this is crucial.
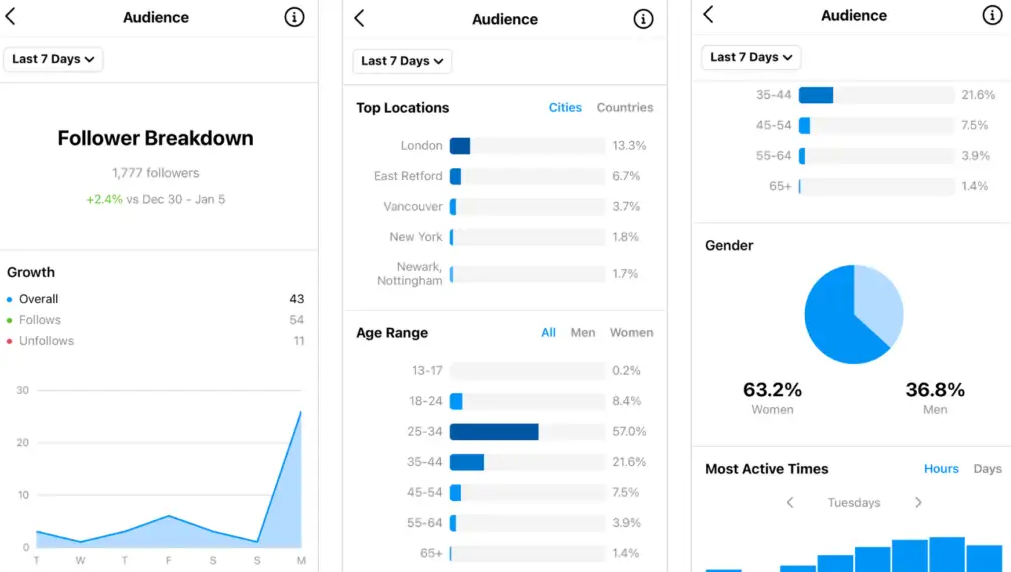
Audience pattern: This isn’t really a measure, but rather a set of important data points. These data can give you insight into the kinds of content that are most likely to be effective.
Effective time to post: Just like the name of it. This metric determines the best time to get as much reach as possible.
Instagram Post
Reach: How many people see your post. Thanks to the Instagram algorithm, the more engaging and interesting your content is, the more people will see it.
Post comment rate: Number of interactions as a percentage of followers or reach. You can do this calculation by hand, but a decent Instagram analytics tool will take care of it efficiently.
Post engagement rate: Percentage of followers or reach as number of comments. Count comments separately from overall engagements if your aims involve increasing loyalty and building relationships.
Impressions: Total number of users who have seen your post. This may show how effectively you’re advertising your account and content.
Instagram Stories
Completion rate: How many people really view your entire Story. People watching your entire Story is a sign that your audience is interested in what you have to say.
Story engagement rate: The number of engagements determines the percentage of followers or reach.
Instagram Reels
Reels interaction: Total likes, comments, shares, and saves for a video.
Reels share: How many people have shared your reel?
Drop-off rate: The percentage of viewers who leave before the end.