Instagram Insights is a function that enables Instagram Business Account users to see analytics related to their contents including profile, posts, videos, reels, stories… From this data, you’ll determine what your audience is interested in and engages with the most to better your Instagram strategy.
Instagram Insights is an incredible tool, however, it might be hard to know what to do when you gain access. Listed below are some of the most helpful methods you can use Insights as you grow your profile.
1. Measure reach.
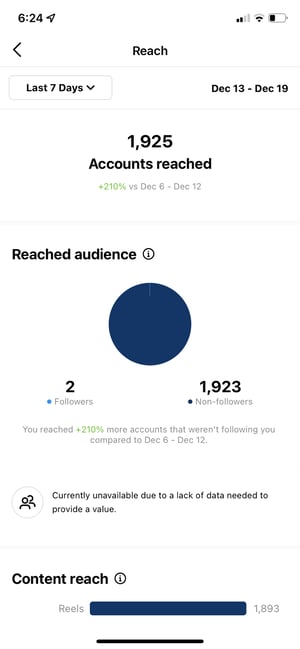
Tap the Accounts Reached section. This data shows the number of unique users that have seen any of your Instagram posts.
Within this category, you will see insights for:
- Top Posts: The posts that gain the most reach.
- Top Stories: The Stories that get the most reach.
- Impressions: The number of times your posts were seen.
- Profile Activity: Profile visits, site taps, and other activities.
Some of those data might be expanded for extra insights.
2. Track profile visits and followers.
At Accounts Reached page, under Account Activity, you’ll find Profile Visits.
Profile Visits show the number of times your profile has been visited.
Find out how many visitors are becoming your followers by dividing your number of followers by the number of visitors. Track this data over time to identify whether your “conversion rate” is growing or not.
3. Decide website clicks.
Navigate Website Taps below Accounts Reached > Profile Activity. This data shows the number of times any links you’ve got inserted in your profile have been clicked.
4. Track content interactions.
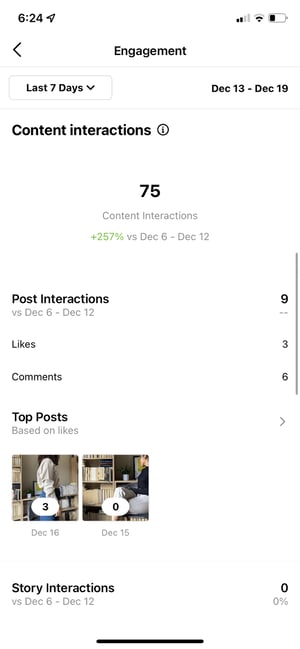
Navigate back to Insights Overview and choose Accounts Engaged. It will bring up a page that shows how your content is performing when it comes to engagement, breaking down the metrics by content type.
Likes speak for themselves, showing the number of users who drop heart on your post. As with likes, Comments show how many comments are left on your post. Saves reflect the number of unique users who saved your post. If any of those numbers are low, it’s vital to reevaluate your Instagram strategy.
6. Track your followers.
From Insights Overview, Choose Whole Followers. You will then reach the Follower Breakdown page.
This page highlights the number of followers you have got or lost over the previous week, as well as the average times of day when your followers are using Instagram — insight that can be extremely useful when planning posts.
7. Learn which actions were taken in your post.
To track insights for a particular Instagram post, just visit your profile. Choose the post you’d want to view, then click View Insights right under the image
Under the “Profile Activity” part, you’ll see the number of actions that audiences took on your profile as a result of seeing your post — things like visiting your profile, then clicking on your link, or following you.
8. Use “Reach” to see where your post showed up in feeds.
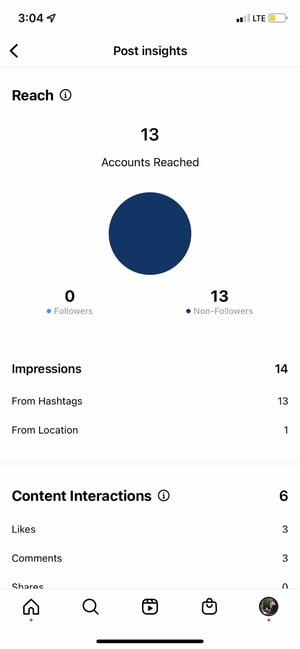
Previously named “Discovery,” Reach indicates where your post was seen — or found — the most, including the number of accounts that weren’t already following you once they first saw the post.
This part contains data on Impressions, which show how many times your post was found from a specific place within Instagram, just like the user’s home feed, a hashtag, a location tag,…
Reach insights also contain data on a post’s reach — which shows how many unique users that view your post.
9. View Story insights.
Instagram business users are able to view insights into their ephemeral Stories.
To view your Story insights, Tap Insights and scroll down to find Content You Shared option on the Insights Overview page.
Then, tap the Stories, and you’ll see data about older stories, as well as any that haven’t yet expired.
Below, we will get into the more particular insights you could measure.
Impressions
This statistic reflects how many times your Story was seen.
When viewing these insights, remember that you are able to add multiple photos or videos to your Story. When you track this, every piece of visual content in your Story is counted as a single photo or video in your post.
For example, you add six images to your Story. Whether someone only views one or views all the stories, Instagram only counts your entire Story having got one impression.
The same goes for Story content that has been seen by a single user more than once. Instagram still only counts that action as the entire Story having got one impression.
Reach
This insight highlights the number of unique users that have seen your Story.
Taps Forward
This statistic shows how many times a user taps your Story to skip to the next piece of Story.
Taps Back
This insight highlights the number of times a user taps your Story to look back to the previous piece of Story.
Replies
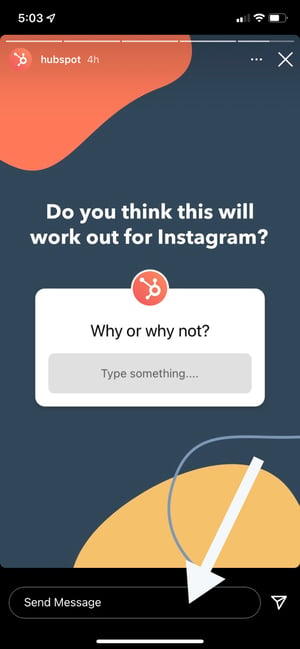
This data displays the number of times users reply to your Story through the Send Message text box.
Swipe Aways
This statistic highlights how many times users swipe to skip to the next Story — not to be mistaken for “tap forward,” which shows users quitting to view the Story.
Exits
This perception displays the variety of instances a consumer leaves the Tales part totally to return to the house feed.
Measuring Your Effectiveness With Instagram Insights
Now that you understand how to access data to build your strategy with Instagram Insights, you could analyze that data and decide what’s or what’s not working for your users. From these, preparing content that will get lots of engagement will be a lot simpler as you consider these benchmarks.


