With prime placement, interactive stickers, and links, Instagram Stories becomes a vital channel for brands seeking to boost awareness, traffic, sales, and engagement. Despite their fleeting 24-hour lifespan, Instagram Stories can leave a lasting impact. By focusing on the right metrics, you can optimize your Stories to meet social media goals. Explore this guide to Instagram Story metrics to gain insights into viewing analytics and determining crucial metrics for building an effective strategy on this influential channel.

How to view Instagram Story Metrics
Accessing Instagram Story analytics is just a few taps away. Grab your phone and follow these steps to delve into the stats of your latest Instagram Story. Note that you’ll need a Professional or Creator account to access analytics. Here’s how to set that up:
1. Open the Instagram app and tap on your profile.
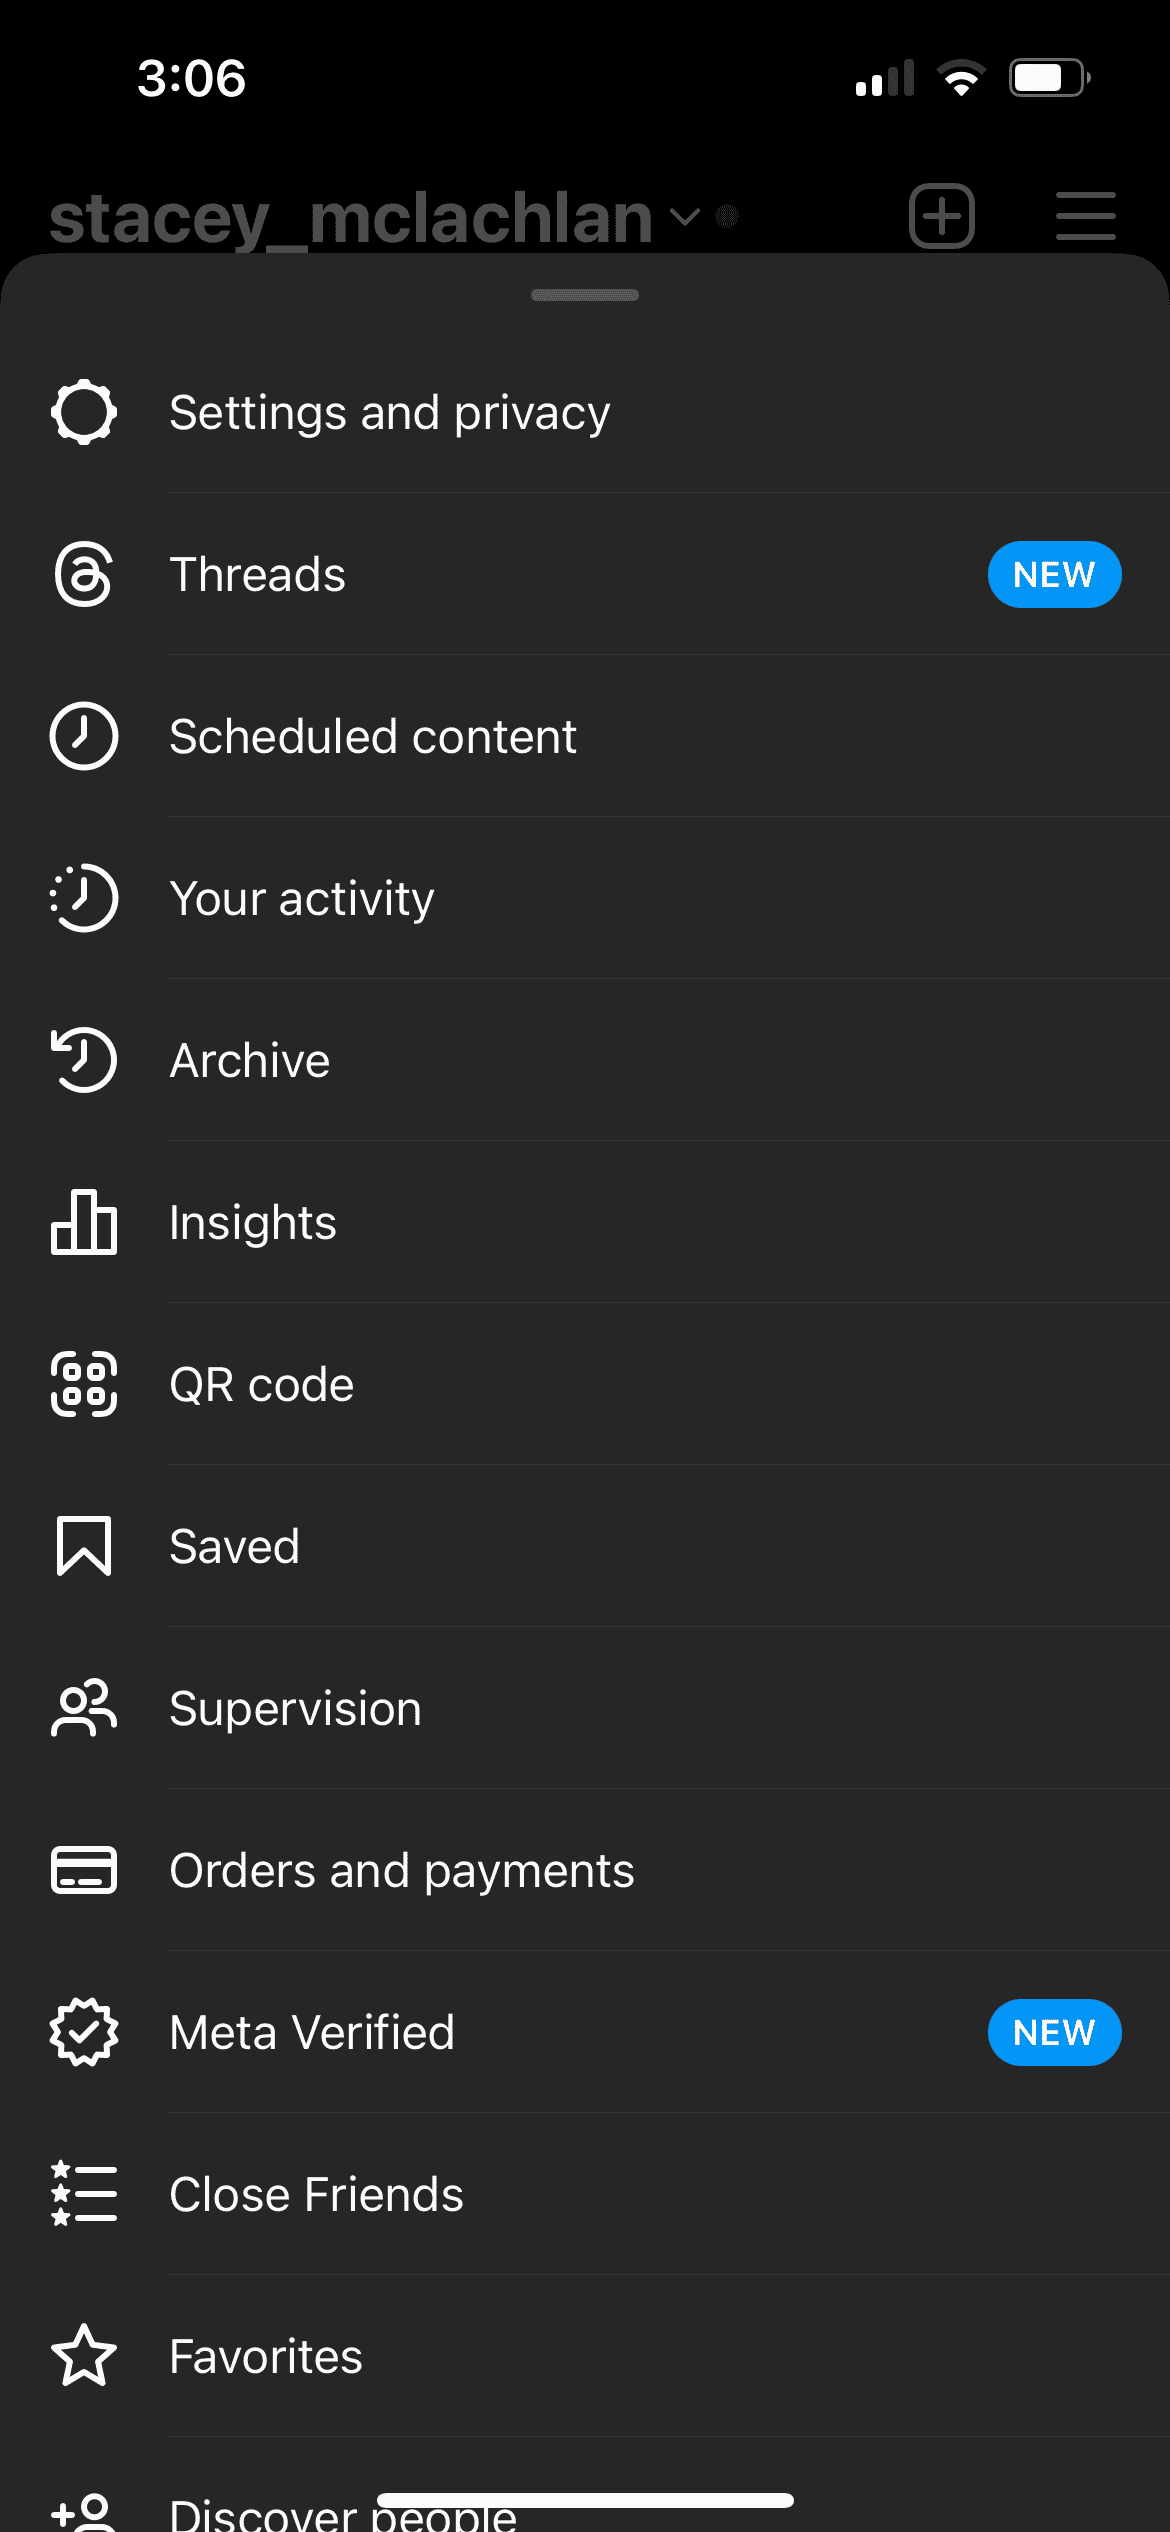
2. Tap the menu icon in the top right corner (three vertical lines).
3. Tap Insights.
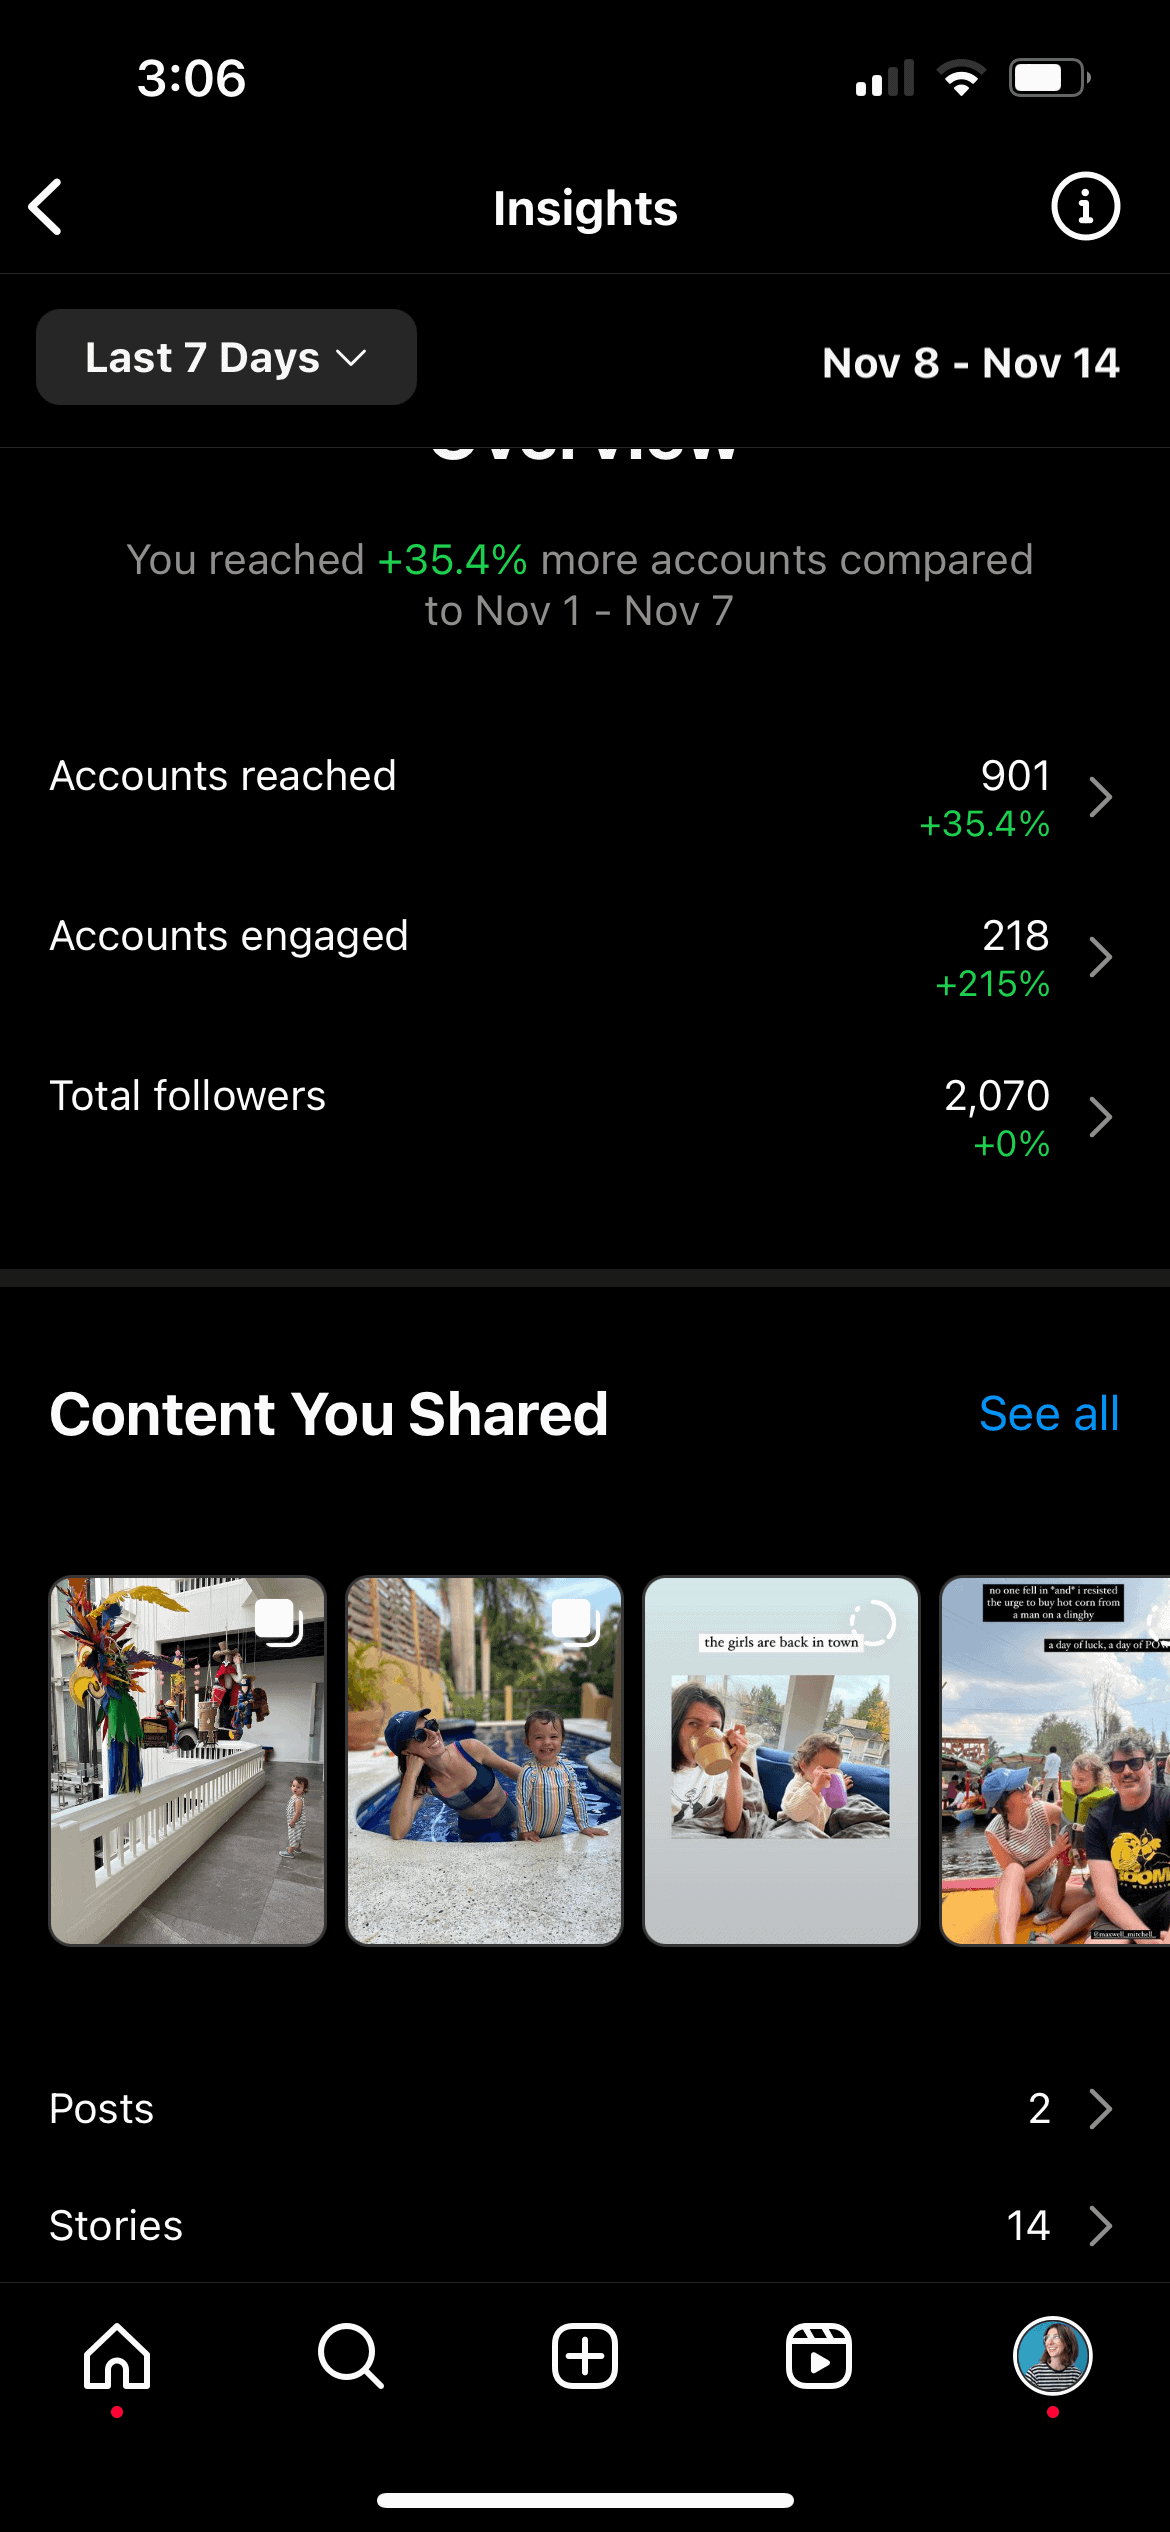
4. Scroll down to the section labeled Content You Shared and tap Stories.
5. A grid of your most recent stories will appear, each labeled with its reach.
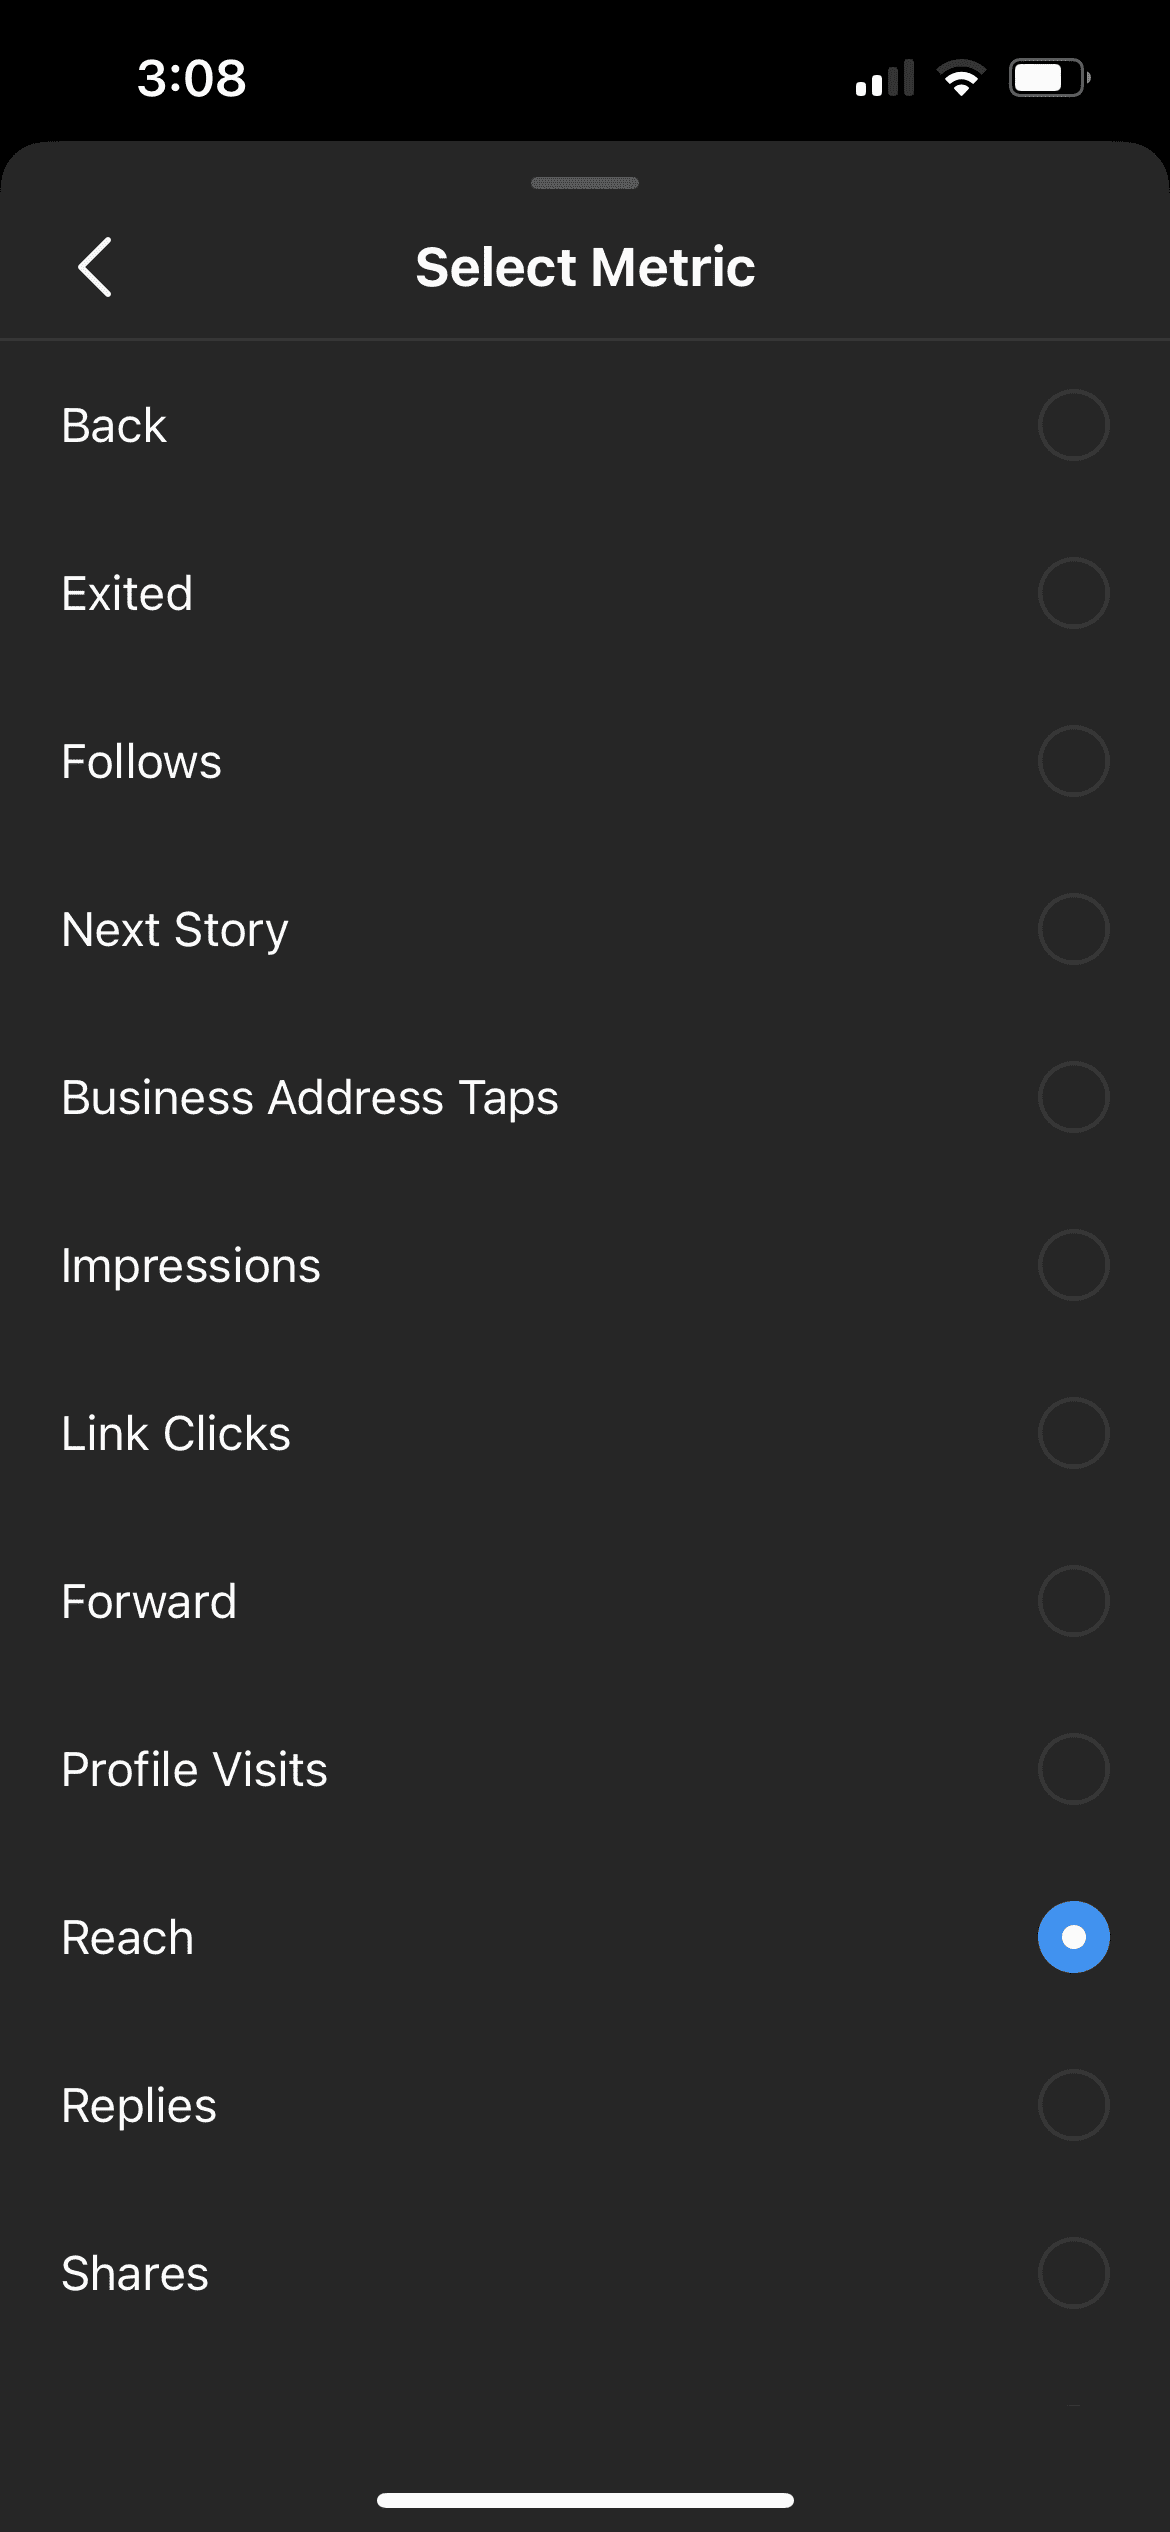
6. Tap the filter icon at the top of the screen to switch metrics. Current metrics include:
- Back
- Exited
- Follows
- Next Story
- Business Address Taps
- Impressions
- Link Clicks
- Forward
- Profile Visits
- Reach
- Replies
- Shares
- Website Taps
- Likes
- Story Interactions
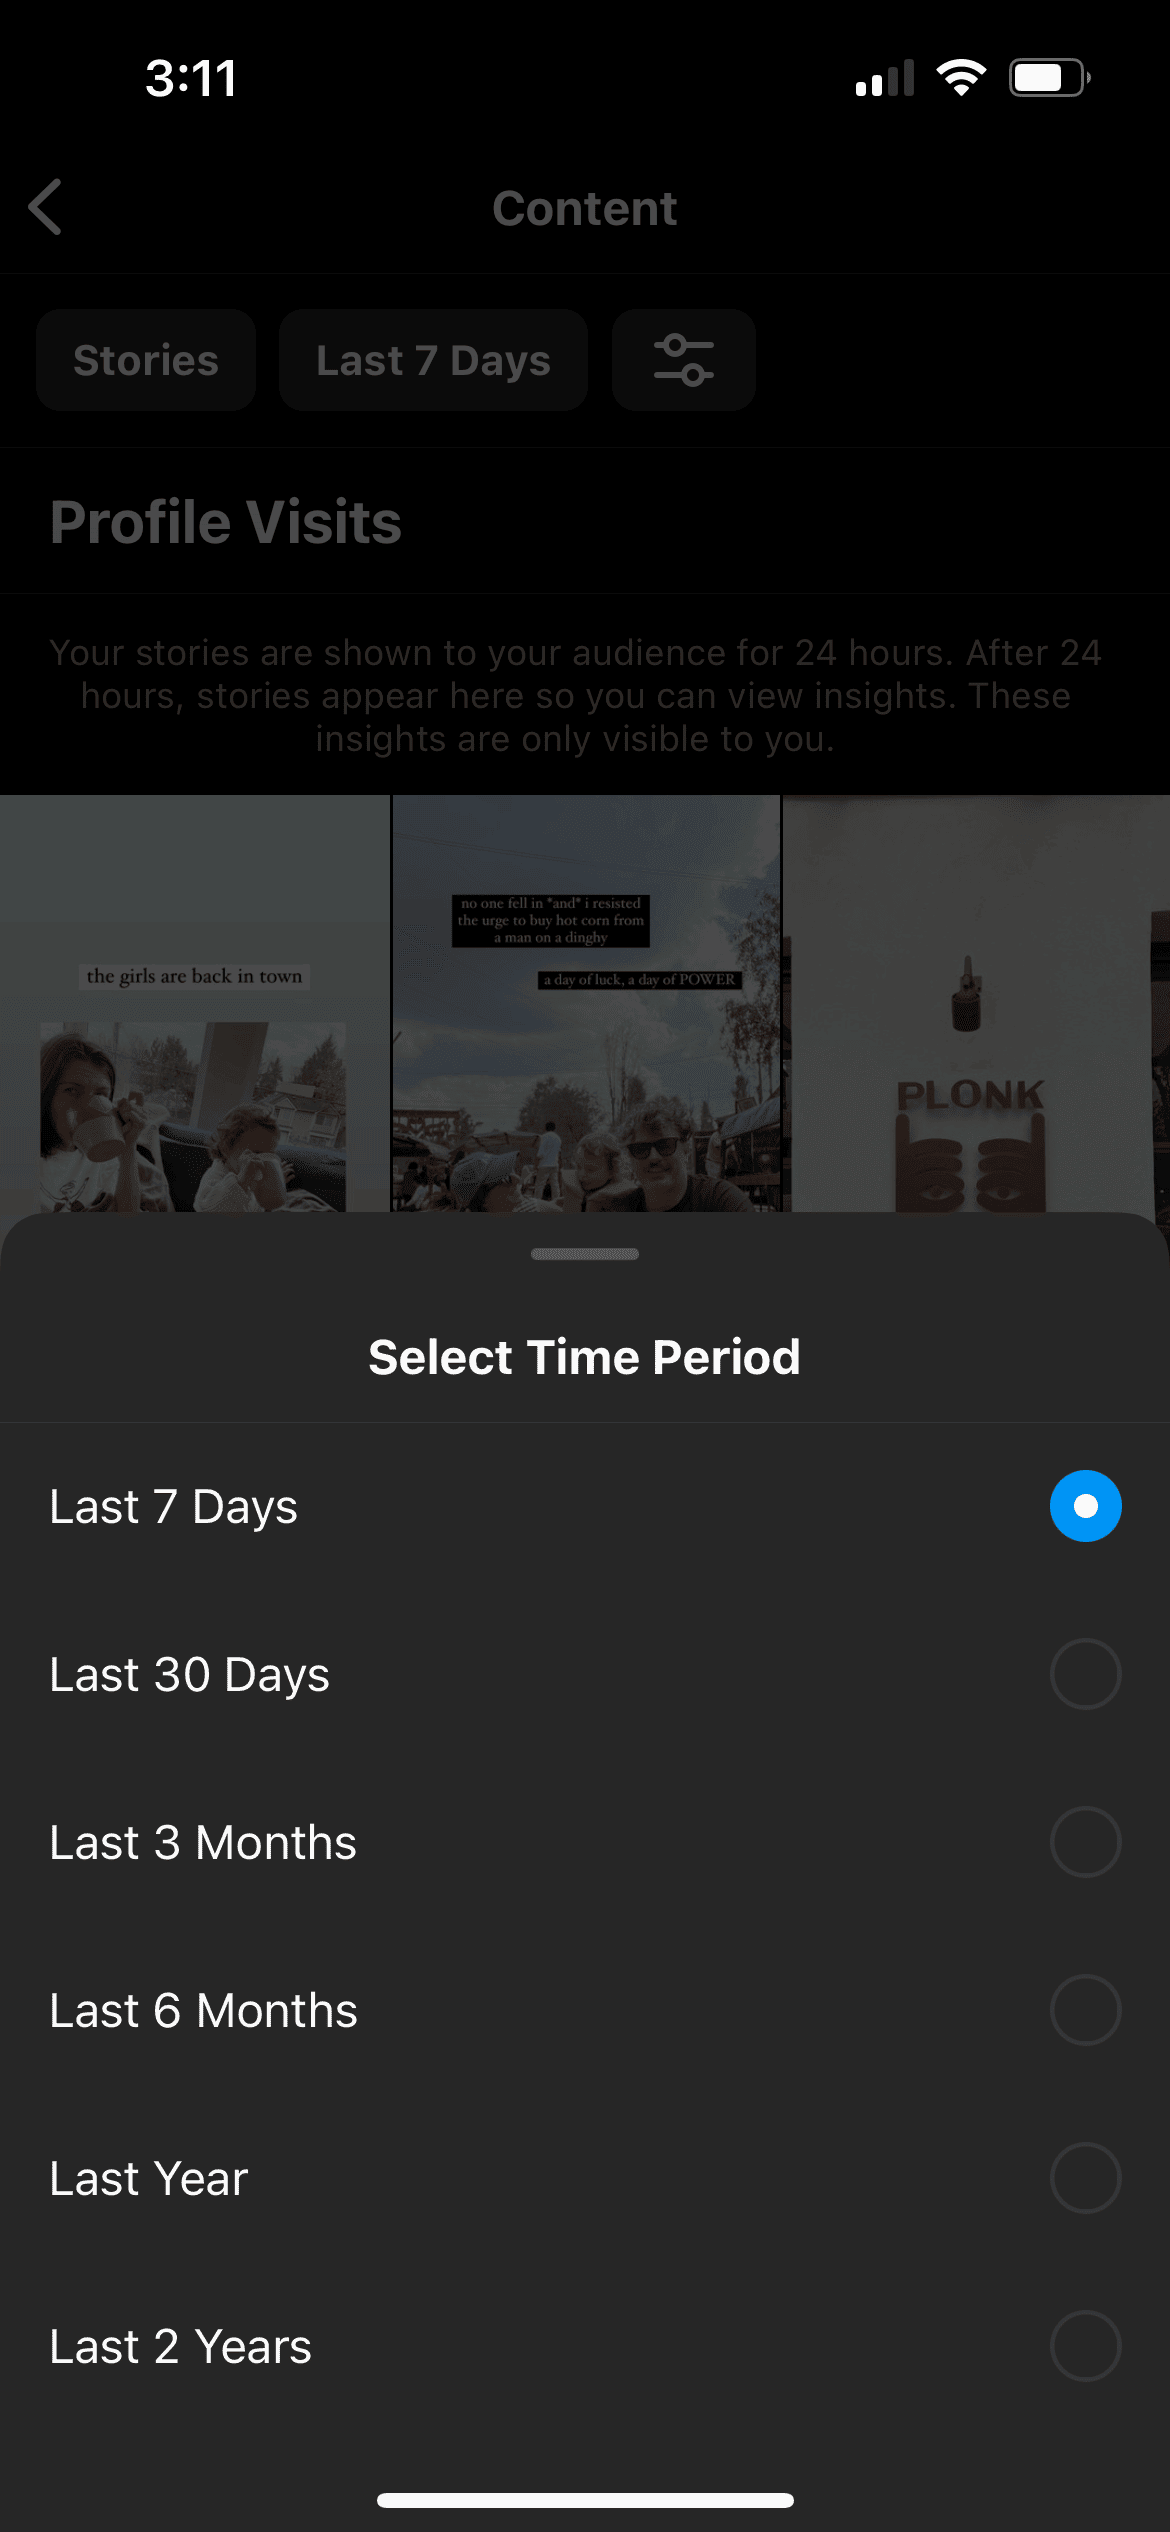
7. To change the time frame of the metrics, tap the button at the top of the screen that says Last 7 Days to view more options (like “Last 30 Days” or “Last 2 Years”).
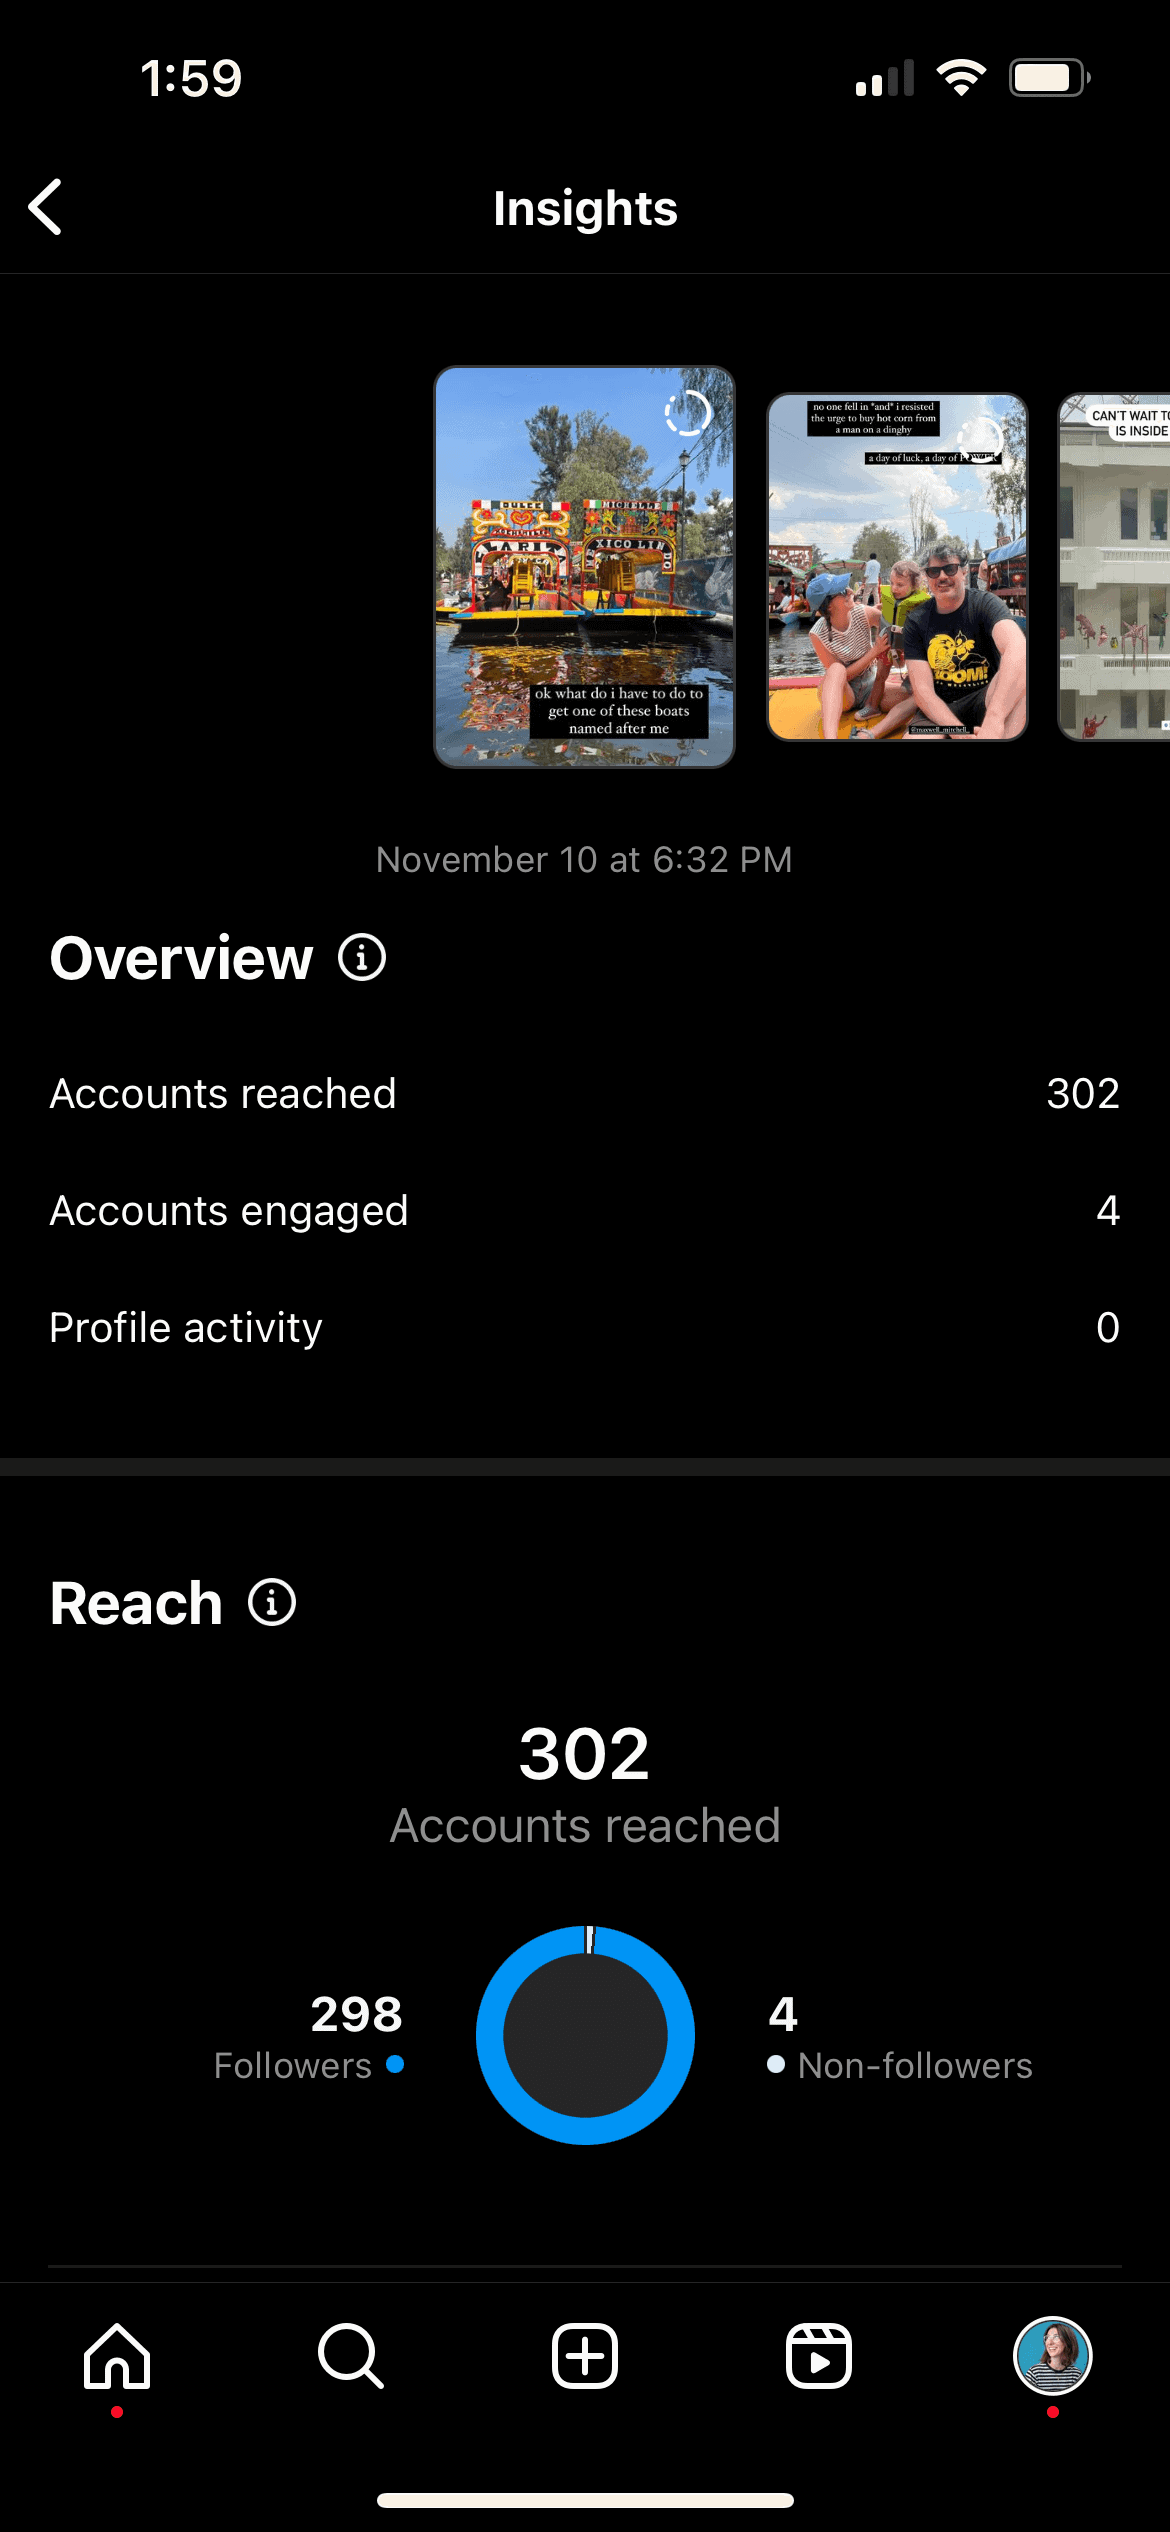
8. Tap on any Story to view detailed metrics for that particular piece of content. You can see how many accounts it reached, how many it engaged, how many interactions it got, and more.
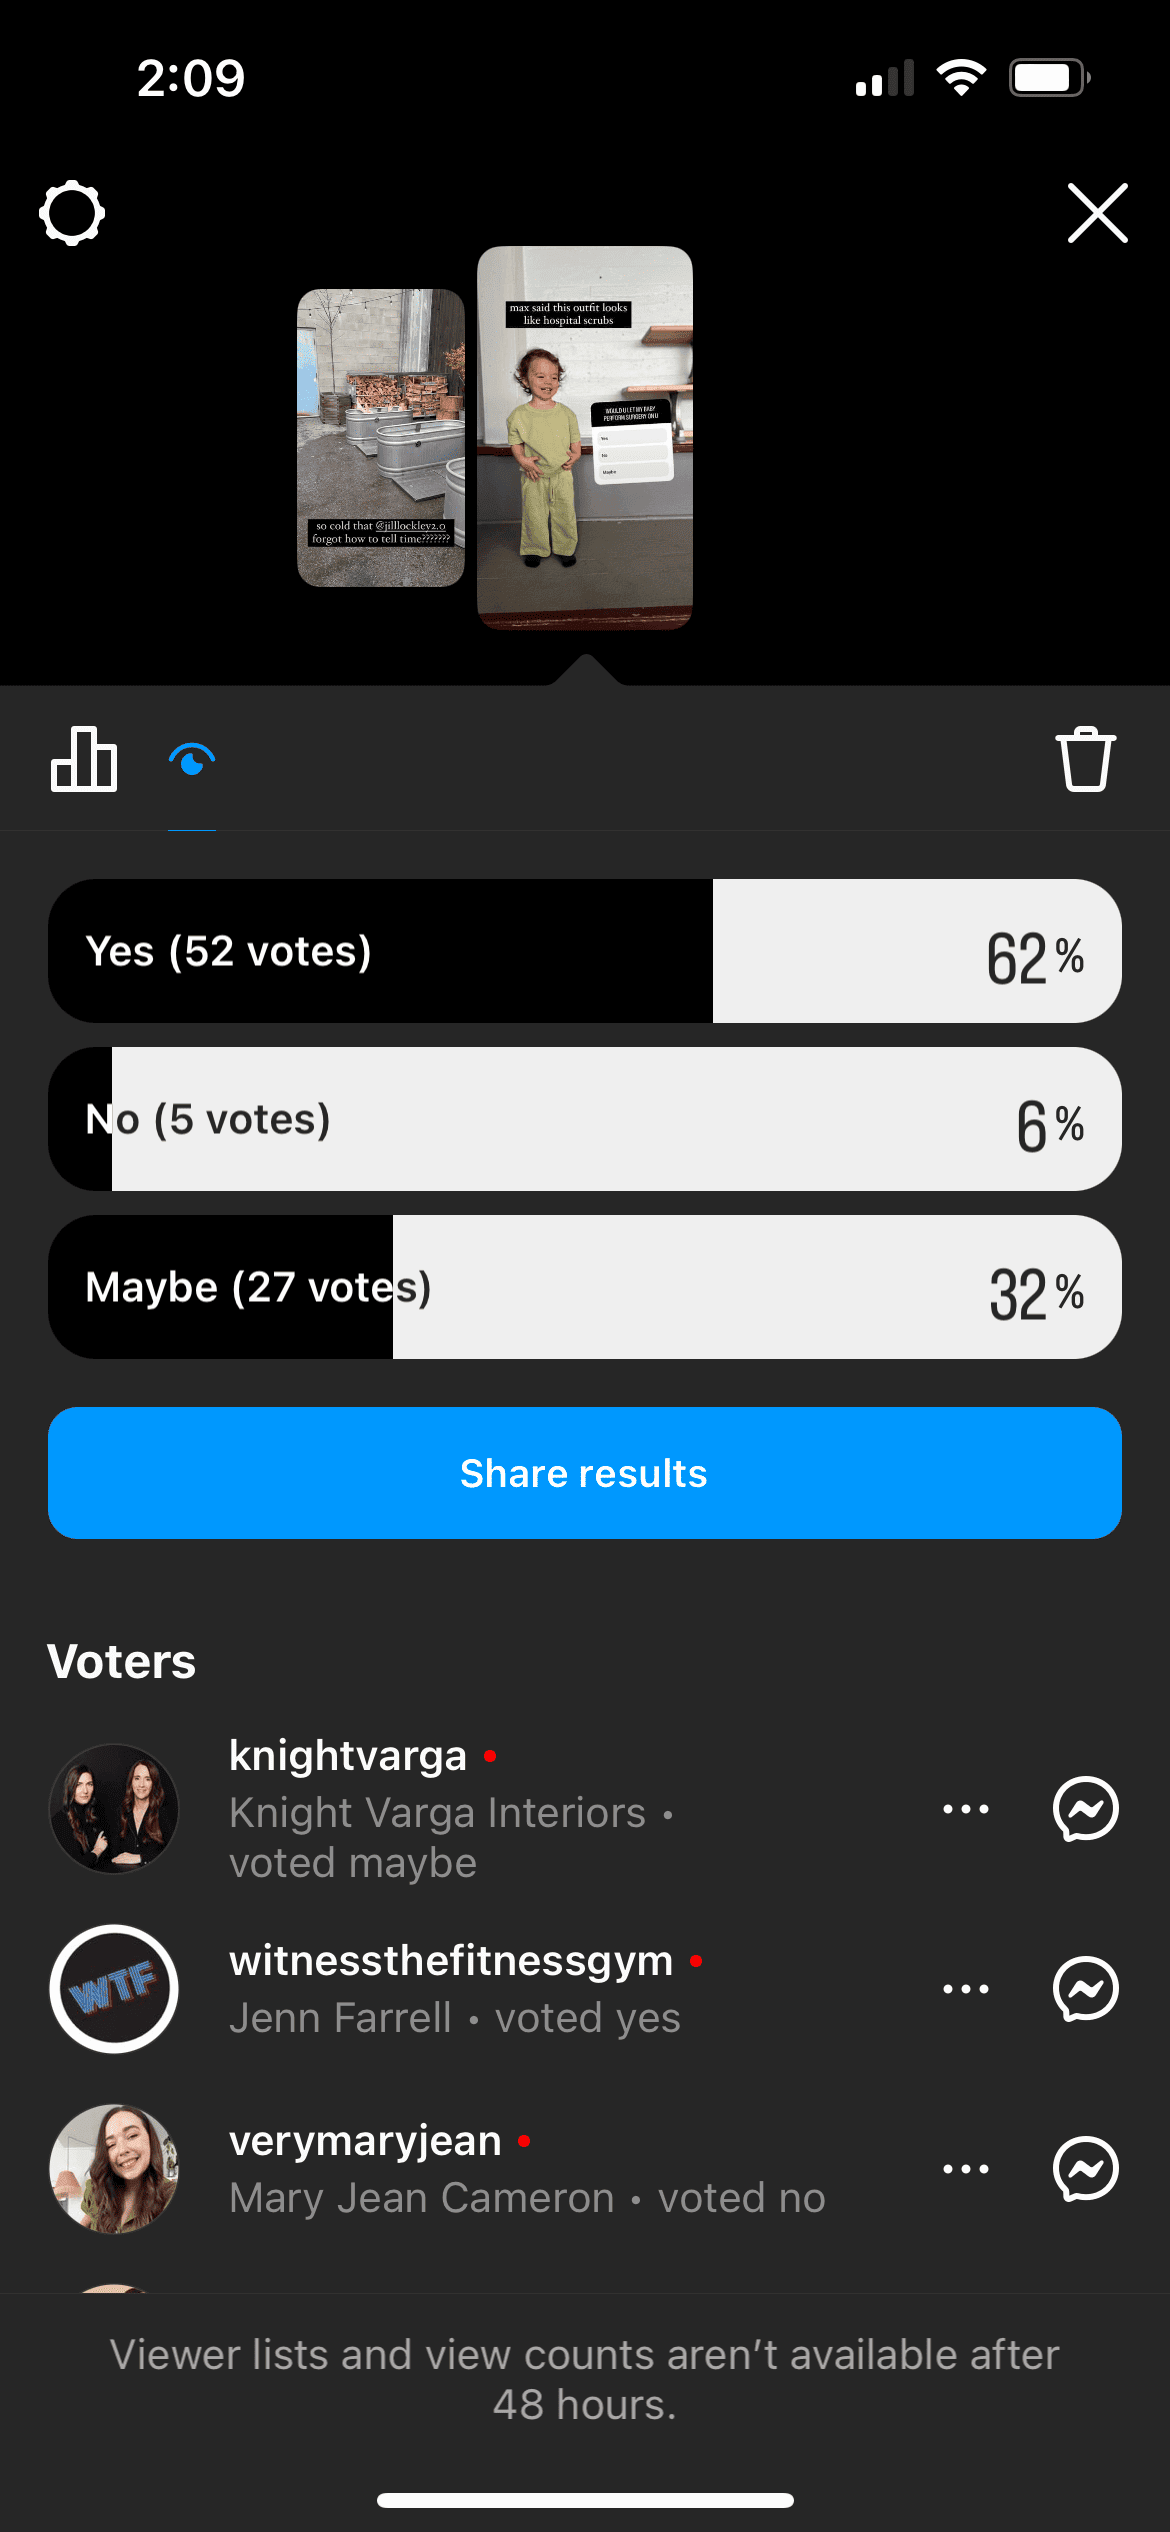
9. To view the results of a poll or interactive sticker, go into your Archives (via the three-vertical-line menu). Then, find the relevant Instagram Story and tap Activity in the bottom left corner.”
Tracking 15 Instagram Story Metrics
There are 15 diverse metrics to track for your Instagram Stories, categorized into Discovery, Navigation, and Interactions. Not every metric is crucial for your brand or aligns with your social media goals.
Instagram Story Analytics: Discovery Metrics
- Reach: The number of accounts that saw your story (an estimated figure).
- Impressions: The total views on your story, including repeat views.
Why Discovery Stats Matter: Instagram is a platform for brand discovery. According to a Facebook survey, 62% of people show increased interest in a brand or product after seeing it in Stories. Compare reach and impressions to your follower count to assess your audience engagement.
Instagram Story Analytics: Navigation Metrics
- Forward Taps: Number of taps to the next story.
- Back Taps: Number of taps to view the previous story.
- Next Story Swipes: Number of swipes to the next story.
- Exit Story Taps: Number of taps to exit your story.
Why Navigation Stats Matter: Navigation metrics reveal the effectiveness of your content. A high exit rate may indicate content disinterest, while back taps suggest content worth revisiting. Stories with repeat views could be ideal for Instagram Story highlights.
Instagram Story Analytics: Interactions Metrics
- Likes: Number of likes on your Story.
- Profile Visits: Times your profile was viewed by someone who saw your story.
- Replies: Count of people responding to your story.
- Follows: Accounts that followed you after viewing your story.
- Shares: Times your story was shared.
- Website Visits: People click the link in your profile after watching your story.
- Link Clicks: People following your link sticker.
- Business Address Taps: Taps on your business address by someone who viewed your story.
- Interactions: Total actions people took after viewing your story.
Why Interaction Stats Matter: For goals like higher engagement, interaction stats gauge success. If aiming for more followers, compare Profile Visits with Follows. Want to drive website traffic? Website Visits reveal your success.